
Beyond Japan’s GDP: Winners of Japan ¥1,400 Trillion ‘Market Share war’
 DOWNLOAD THE 108-PAGE REPORT HERE
In this Japan Special Report, we first debunk the myth of Japan’s GDP and countries’ gross domestic product (GDPs) and its limited insights regarding sales activities across countries, especially in Japan. In other words, we examined the difference in economic activities before the GDP kicks in regarding B2B and B2C sales in Japan and the United States by answering the following questions: What do winners know that many C-Suites and boards still don’t?
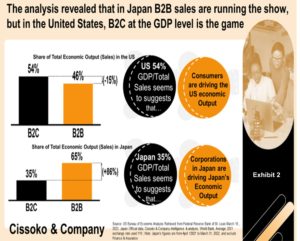
Our analysis of the difference in economic activities at the sales levels revealed that in the Land of the Rising Sun, B2B sales dominate economic activities. In contrast, in the United States, household consumption at the GDP level is key, meaning B2C activities reign supreme.
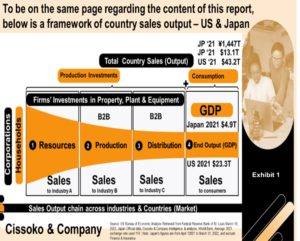
The Land of the Rising Sun by the Numbers –Total Sales (output) Versus GDP
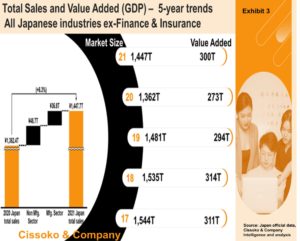
Over the past five years, the difference in sales and value-added (GDP), excluding just the finance and insurance industry, is huge by any account. For example, while the value added in the fiscal year 2021-22 was ¥300 trillion, Japanese companies sold ¥1,447 trillion as the country’s gross sales (output).
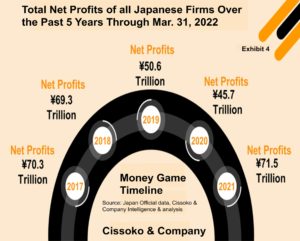
Moreover, the downward trend in Japanese firms’ net profitability over the past five years has been reversed considerably in the past fiscal year (2021-22). It was ¥70.3 trillion in 2017 and trended downward through 2020-21 to ¥45.7 trillion – a 34% decrease. However, in the 2021-22 fiscal year, the net profitability of all Japanese companies and industries jumped by 56% to ¥71.5 – beating the previous record of 2017 by nearly 2%..
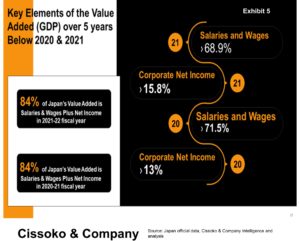
Indeed, to demonstrate that Japan’s GDP doesn’t capture many sales activities, we examined its key components. Our analysis revealed that over the past two previous fiscal years, excluding the finance and insurance industry, 84% of Japan’s GDP was made of salaries and wages plus corporate net income. Yet the average labor productivity improved slightly to ¥7.2 million while employing 41 million people across all industries except the finance and insurance industry.
Thus, given the above facts, we believe that no one needs to be a rocket scientist or the most rigorously trained economist to know what countries’ gross domestic products (GDPs) provide. The flawed acronym GDP can provide just half the story regarding the sales activities within national borders, given that this is not why GDP was created to provide in the first place—many decades ago. The logical question is, what are Japan’s annual sales (gross output)?
The Land of the Rising Sun by the Numbers Over the Past 5 Years
Over the five years of our analysis period through March 31, 2022, sales have plunged more than 6% to ¥1,447 trillion – meaning ¥97 trillion in value has evaporated, excluding finance and insurance. However, the fiscal year 2021-22 may be a turning point, given that, unlike previous years, sales soared by 6.3% over the last fiscal year, 2020-21.
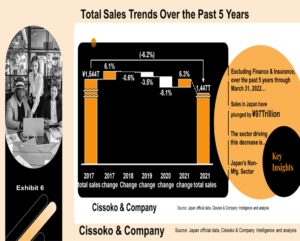
Moreover, our analysis revealed that the two main sectors of Japan’s economy demonstrated varying levels of resilience. That is, Japan’s manufacturing sector accounts for nearly 27% of the sales valued at ¥401.7 trillion in the fiscal year 2021-22 from ¥406.2 trillion five years ago—meaning it lost just 1% of its sales during that period. However, the non-manufacturing sector lost 8% of its sales over the same period—plunging from ¥1,137 trillion to ¥1,046 trillion through the last fiscal year, 2021-22.

Our analysis revealed that the median market share across industries, excluding the finance and insurance industry, was 2.3%. As such, the 10 industries on our list have all crossed the golden line.
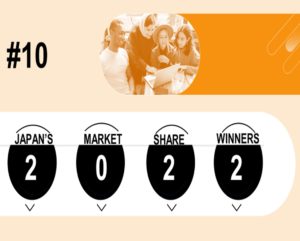
The top four winning industries in 2022 are from the non-manufacturing sector. Moreover, they account for a combined market share of 60%. Behind these four industries is a well-known and influential Japanese manufacturing industry. Indeed, one player in that industry is the world’s number one maker of that vital product.
Get in Touch
We will respond to your message as soon as possible.
Insights to Win
Subscribe to our newsletter for in-depth analysis, reports, and our perspectives on business and economic issues related to the Japanese market and the global economy.