
The Number Game: Debunking the Myth of Japan’s GDP — Where is Japan the King? — Japanese Economy Special Report
When the Japanese economy receives media coverage, negative reports tend to overshadow positive commentary. Primarily, discussions and analyses often focus narrowly on Japan’s vulnerabilities, such as its declining and aging population, the so-called “lost decades” of stagnant economic growth, and its debt-to-GDP ratio.
Consequently, business leaders frequently confuse Japan’s gross domestic product (GDP) with its overall economic output, or misinterpret per capita GDP as per capita sales. This misunderstanding has led many CEOs and business leaders to overlook significant opportunities in Japan.
Our research, arguably pioneering in its scope, aims to dispel numerous myths surrounding the Japanese economy, particularly regarding its GDP. Furthermore, it seeks to highlight where Japan’s economic strengths truly reside—including sales figures for the entire Japanese economy and by sector, industry, and corporate category —with sales that surpass Japan’s GDP in the current era of artificial intelligence. We have no doubt that the readers will be surprised and intrigued by our findings and analysis.
What do Winners Know That Others Don’t?
The disparity between Japan’s Gross Domestic Product (GDP) and its total sales (gross output) was approximately one quadrillion yen, equivalent to ¥1,000 trillion. In the fiscal year 2024-25, the aggregate gross output (sales) of the Japanese economy approached ¥1,700 trillion, representing 2.6 times the GDP (¥642 trillion).
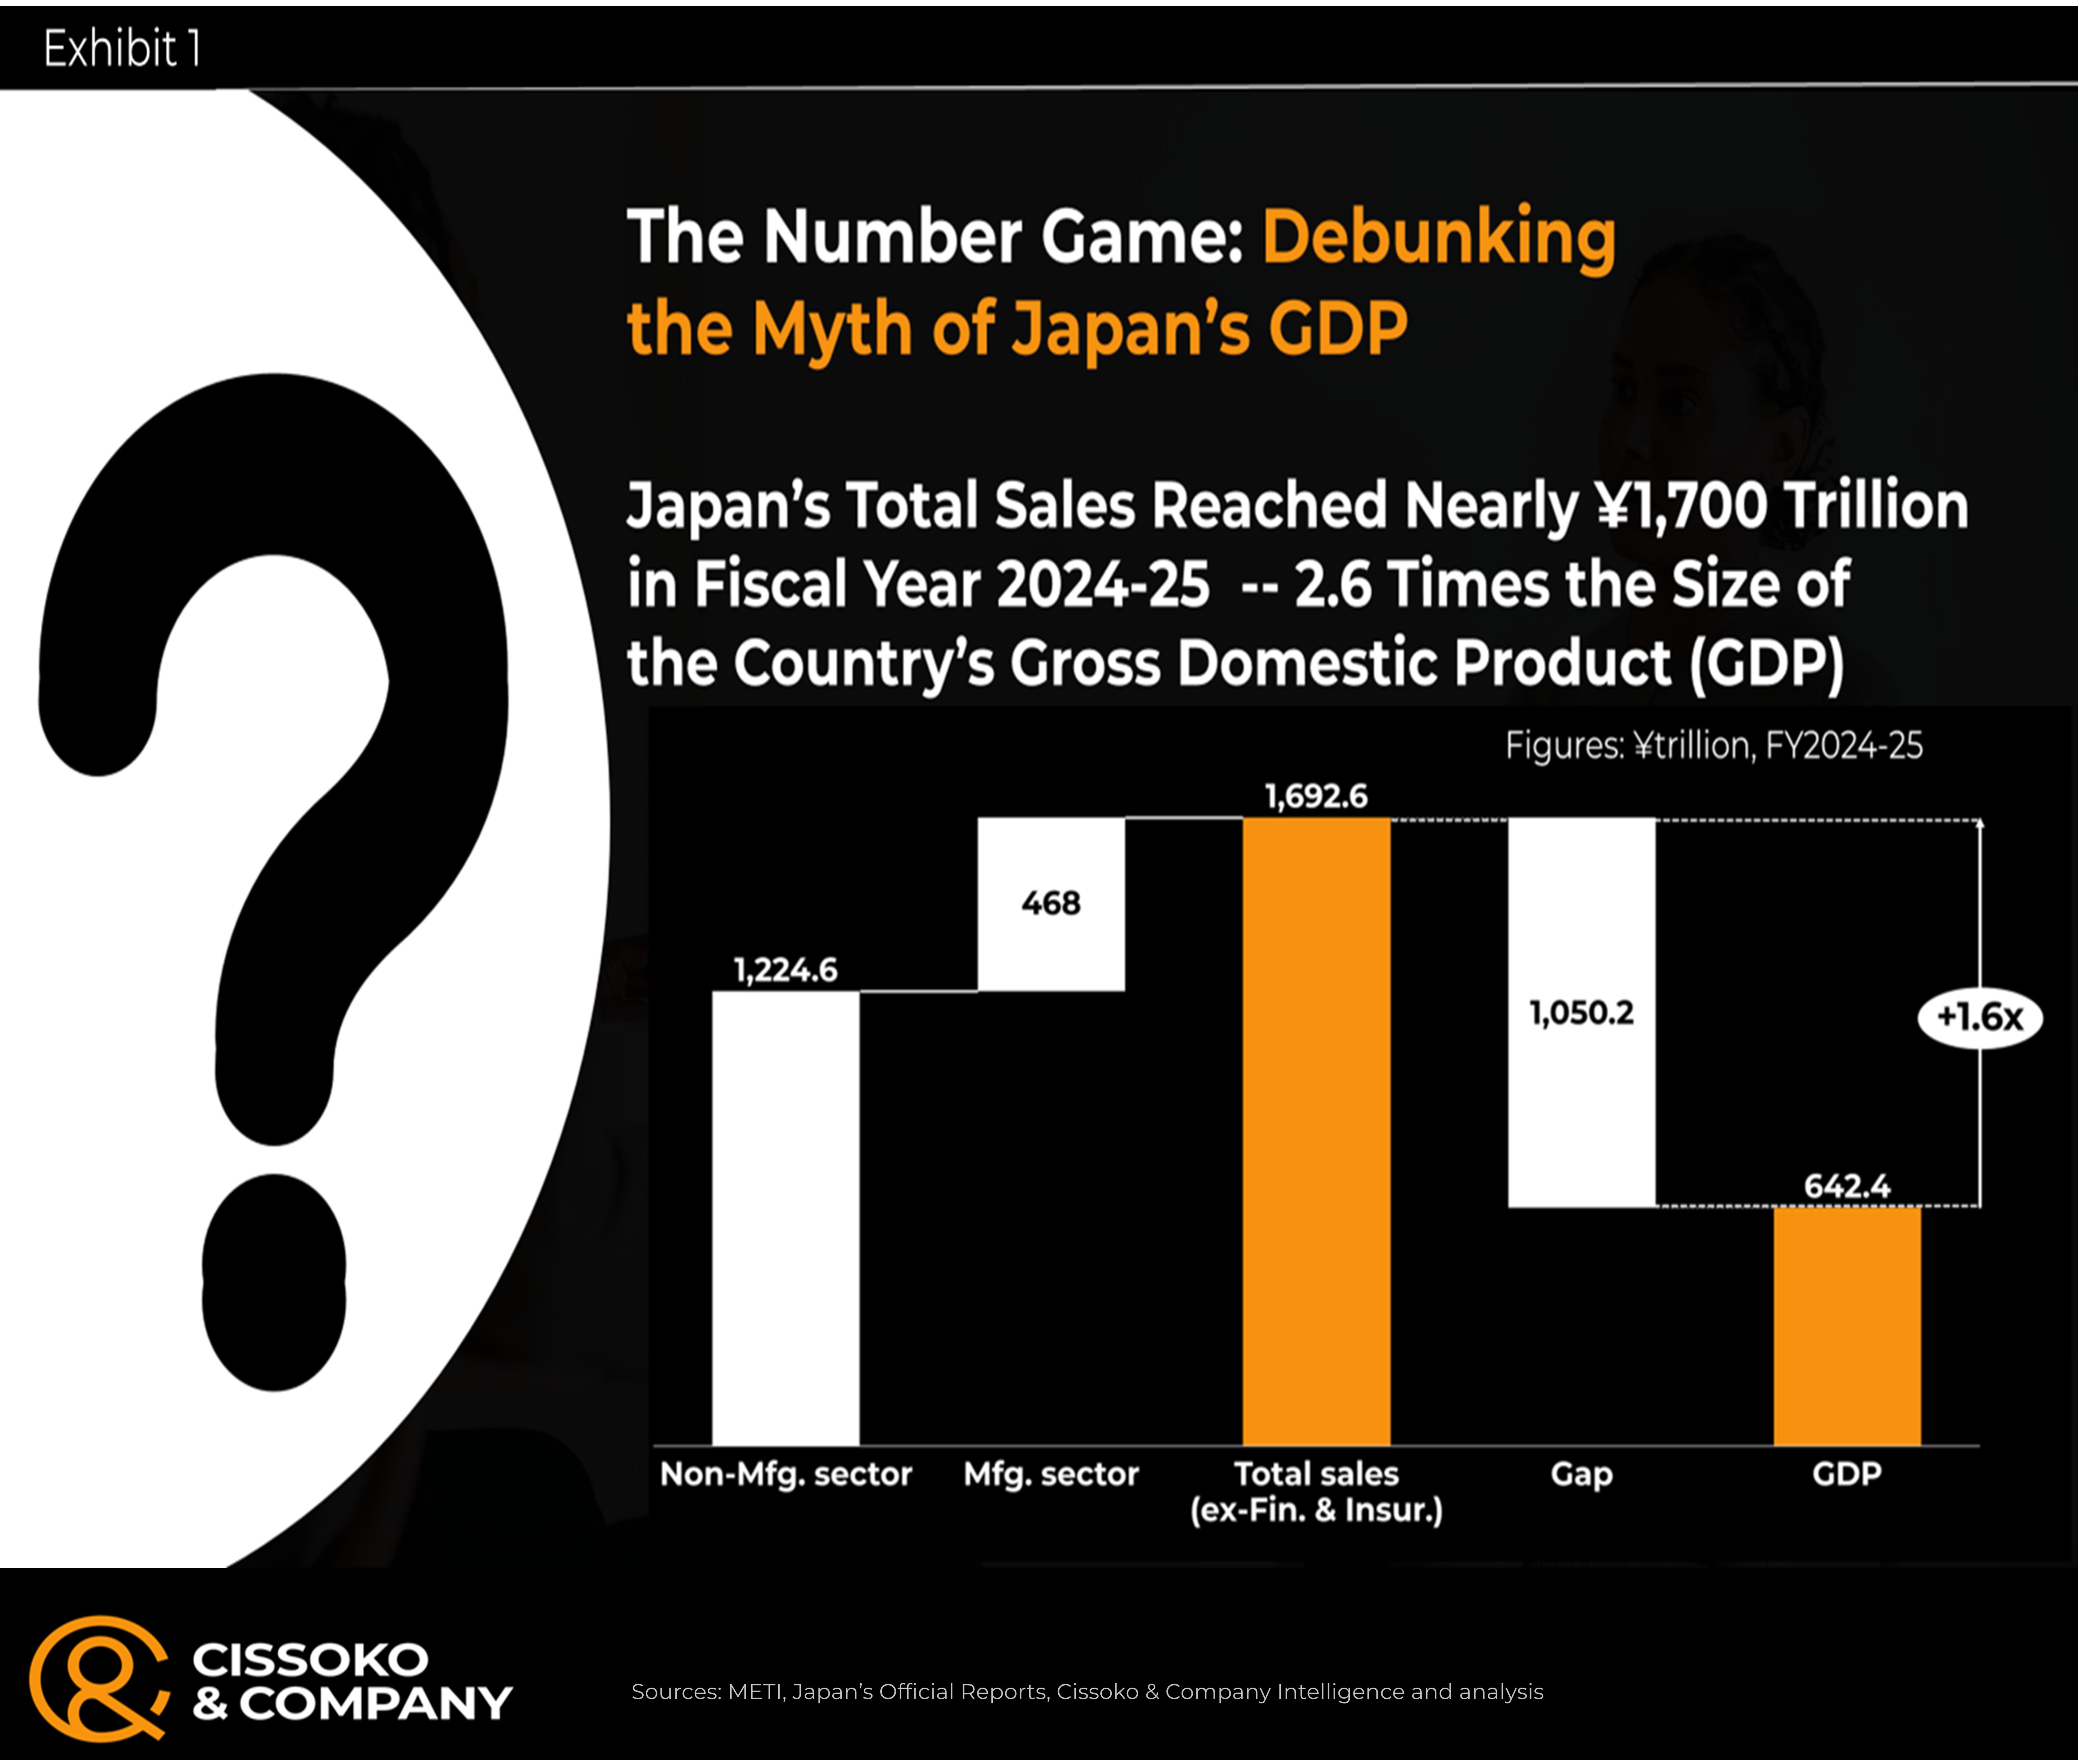
Therefore, conflating these two economically related yet distinct indicators may prove a strategic misstep when considering market entry or expansion strategies in Japan in this age of agentic AI.
The US Economy Versus the Japanese Economy: Where is Japan the King? Spoiler, Sales
The prevailing issue with numerous analyses of the Japanese economy is their narrow focus on the country’s gross domestic product (GDP). Consequently, these analyses are often misguided or significantly flawed, as they neglect Japan’s total sales (gross output) by assuming that Japan’s economic output is represented solely by its GDP (gross value added), a regrettable oversight.
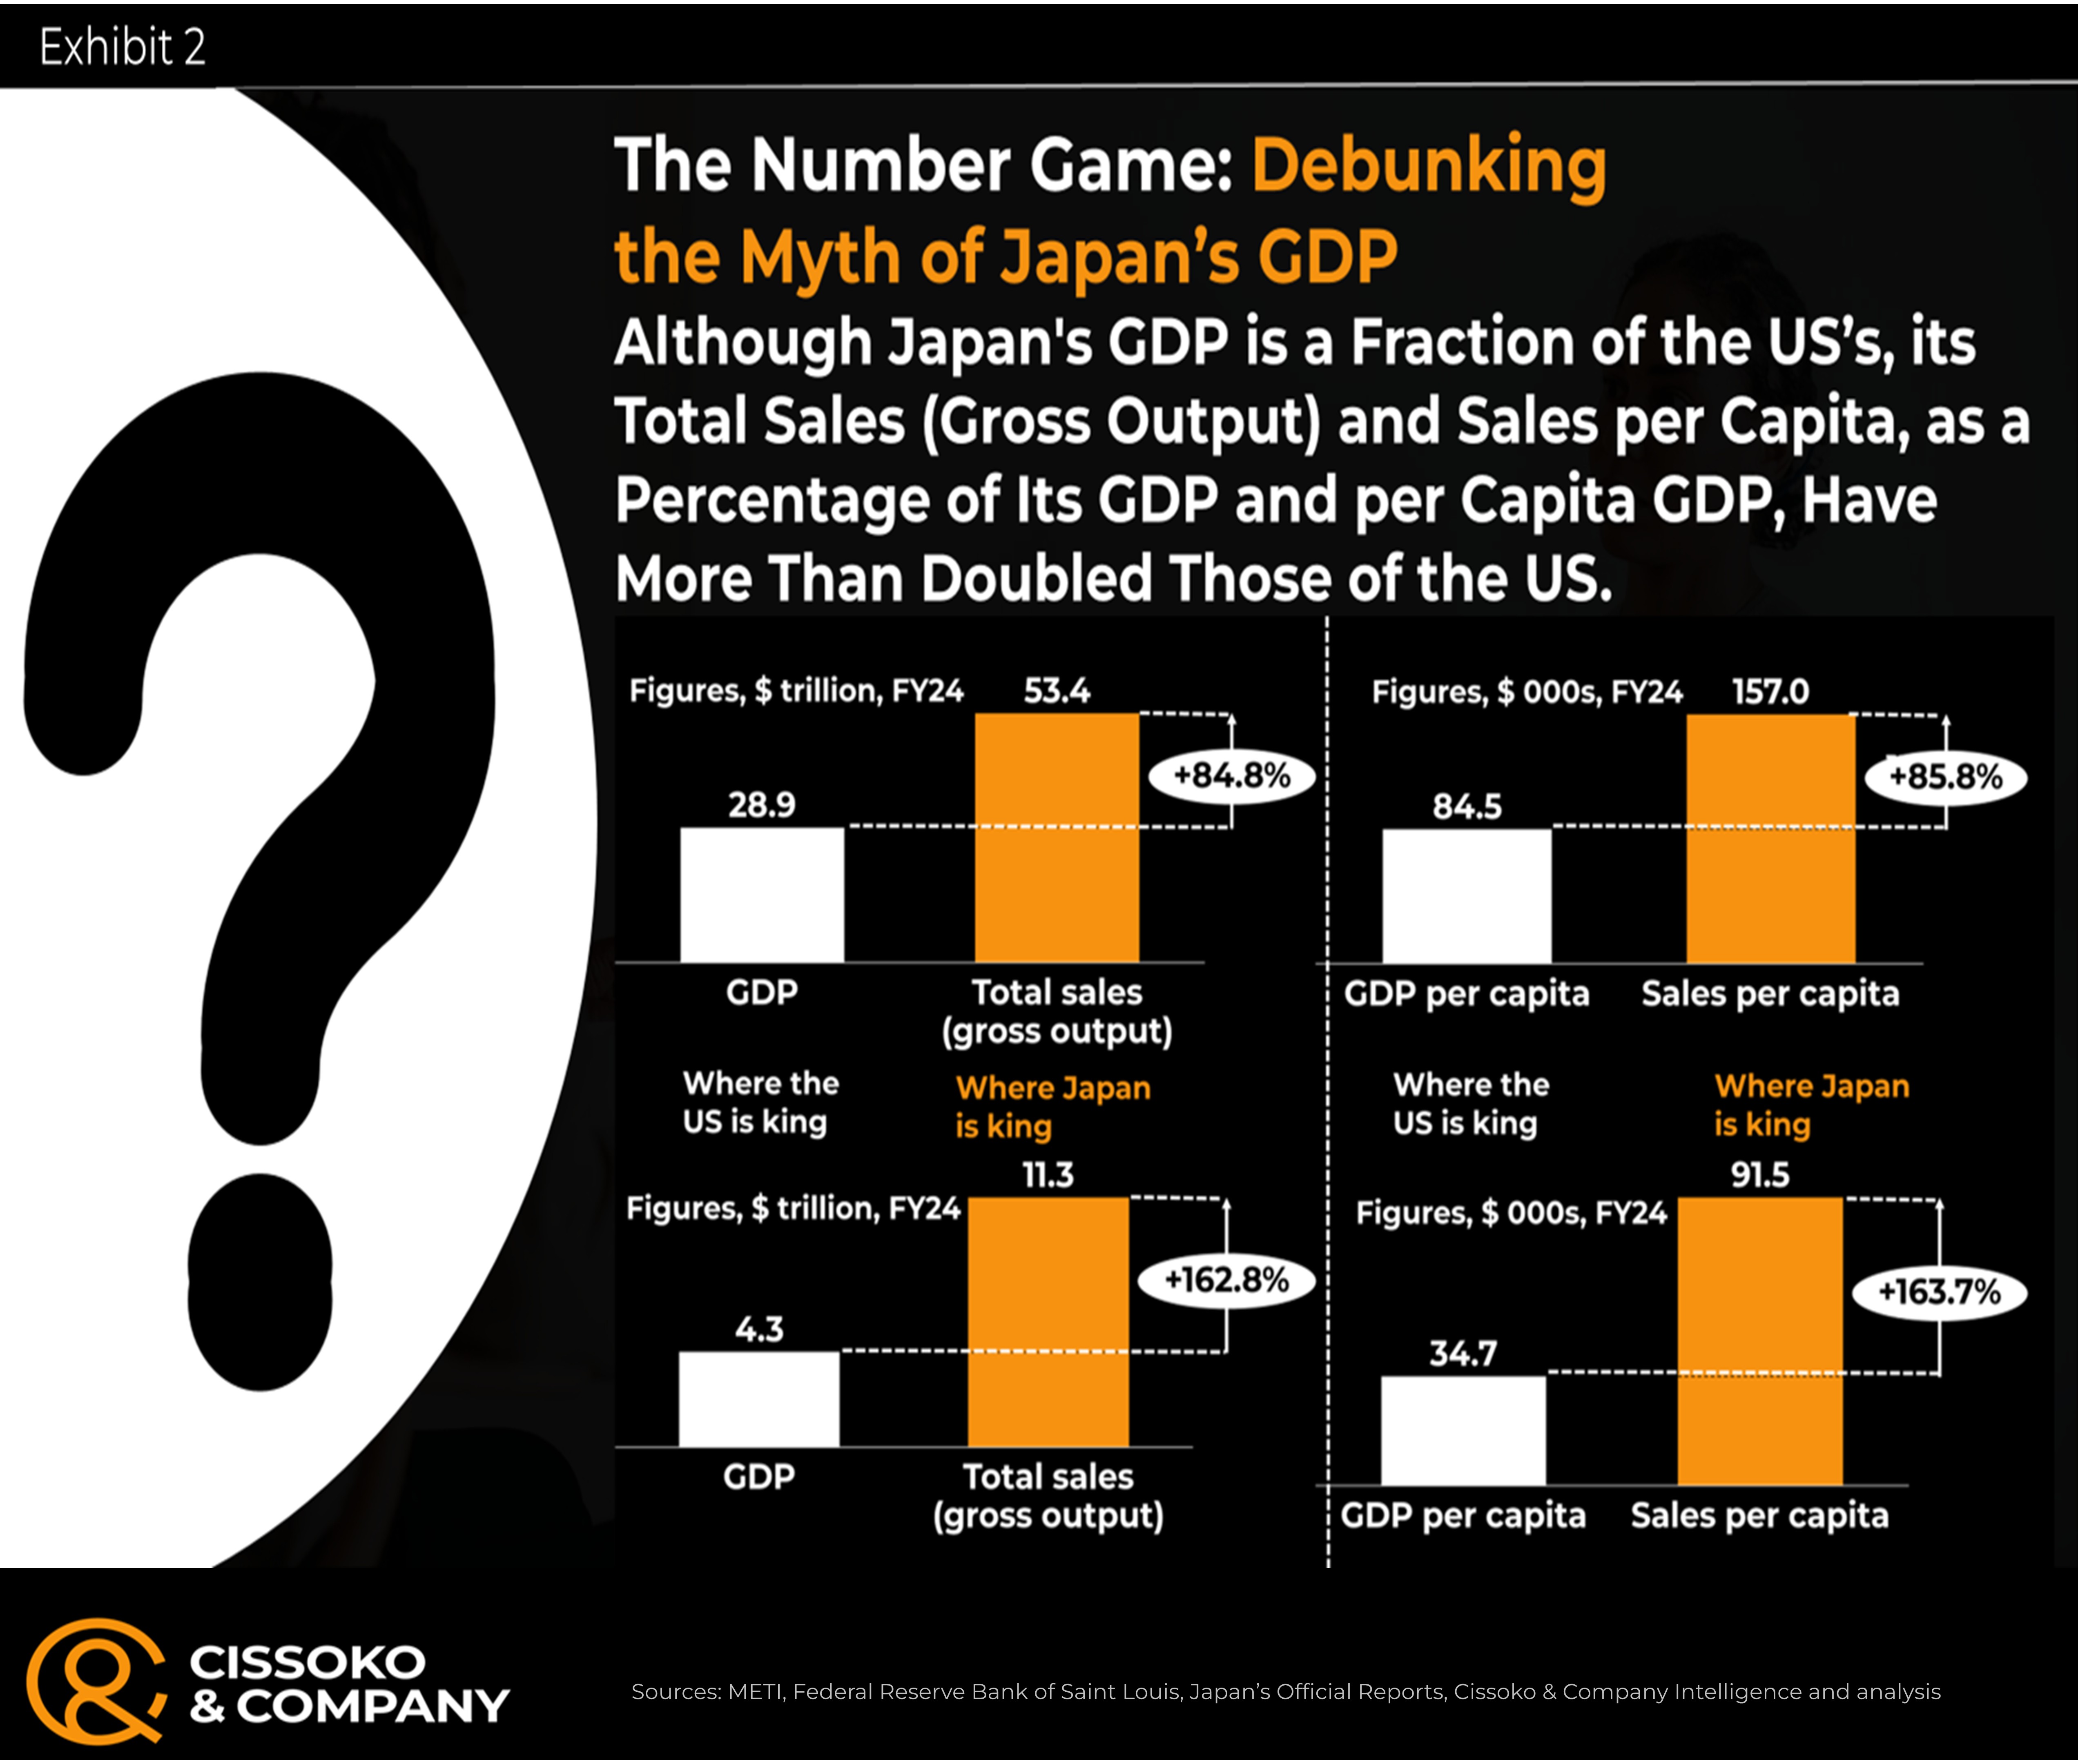
We assert that a comprehensive assessment of the economies of the United States and Japan will provide greater insight into many of their concealed strengths and vulnerabilities. Furthermore, such an approach will clearly delineate areas where Japan holds a competitive advantage or demonstrates relative superiority, as these aspects frequently remain obscure or undisclosed.
The Sales in Japan’s Non-manufacturing Sector Alone Exceed the Country’s GDP
An illustrative way to demonstrate the scale or economic robustness of Japan’s non-manufacturing sector within its ¥1,700 trillion market is to compare its total sales over the years with the country’s gross domestic product (GDP).
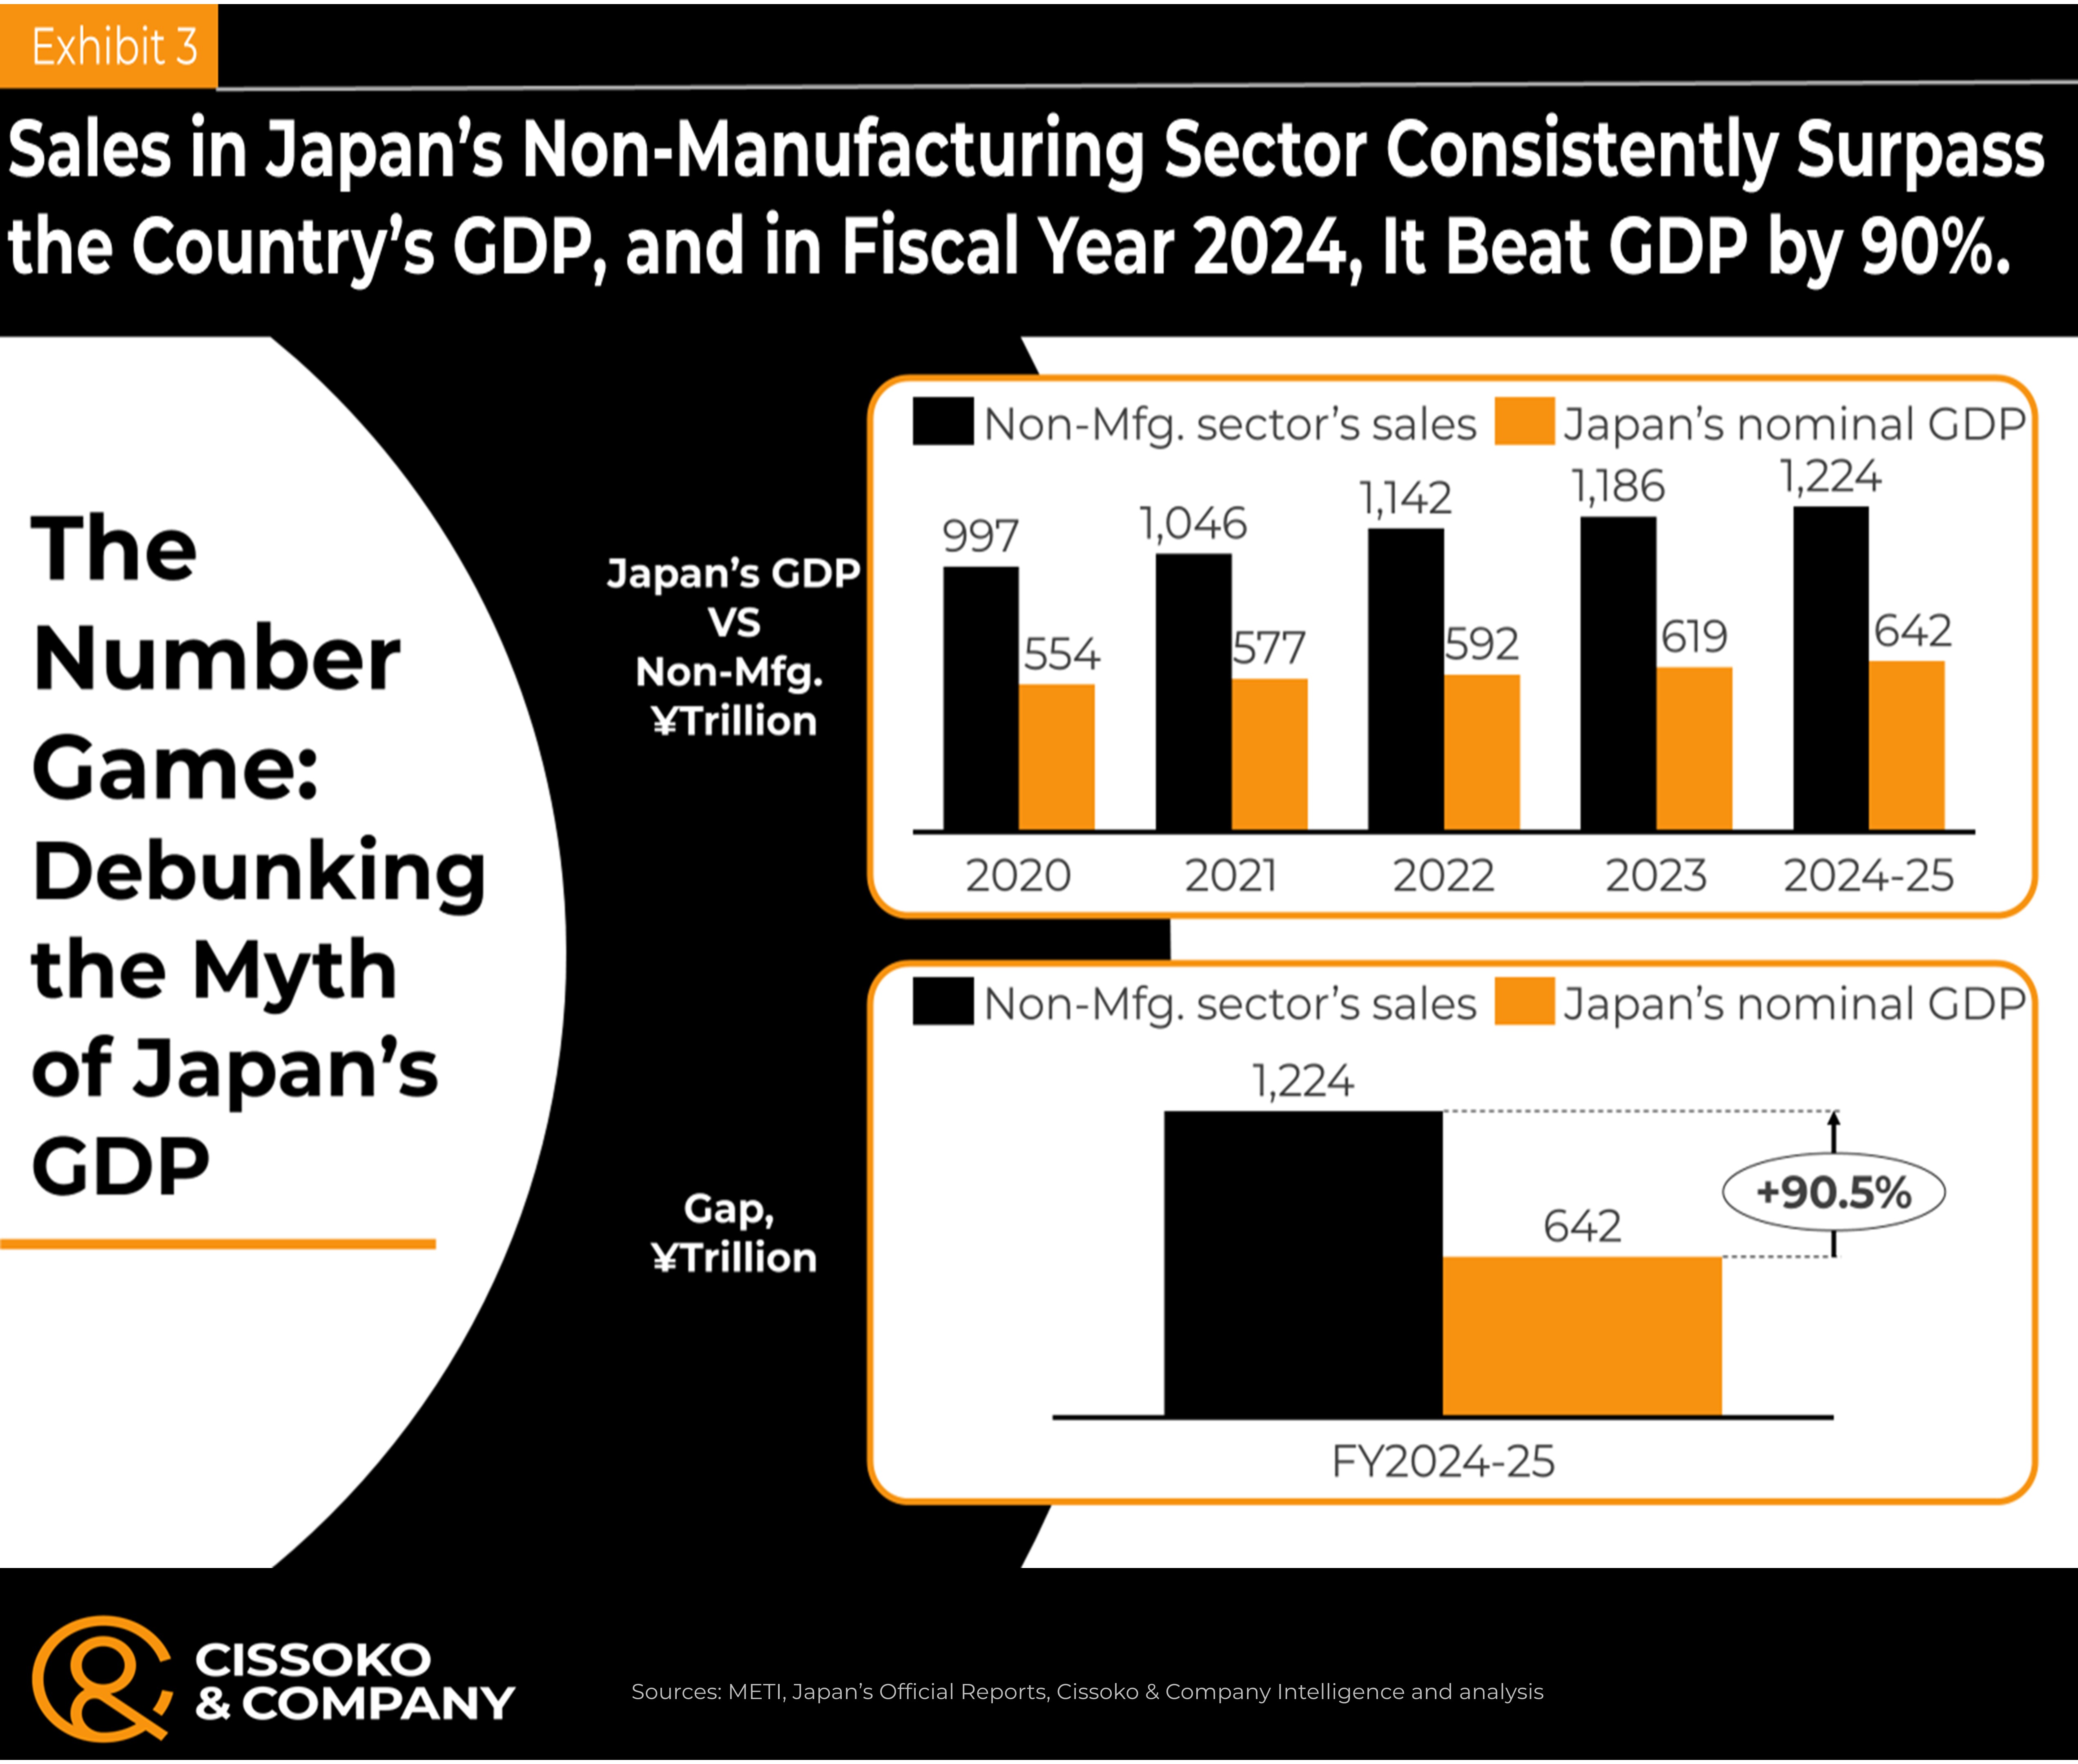
Indeed, the sector’s total sales have consistently exceeded Japan’s GDP for each of the past five fiscal years. Notably, in fiscal year 2024-25, the non-manufacturing sector’s sales surpassed the country’s GDP by an impressive 90%.
The Combined Sales of two Japanese Industries Surpass the Country’s GDP
Another notable aspect of the Japanese economy is the substantial sales capacity of certain key industries relative to others. An analysis was conducted to compare Japan’s Gross Domestic Product (GDP) with two primary sectors: wholesale and retail trade, and the services industry.
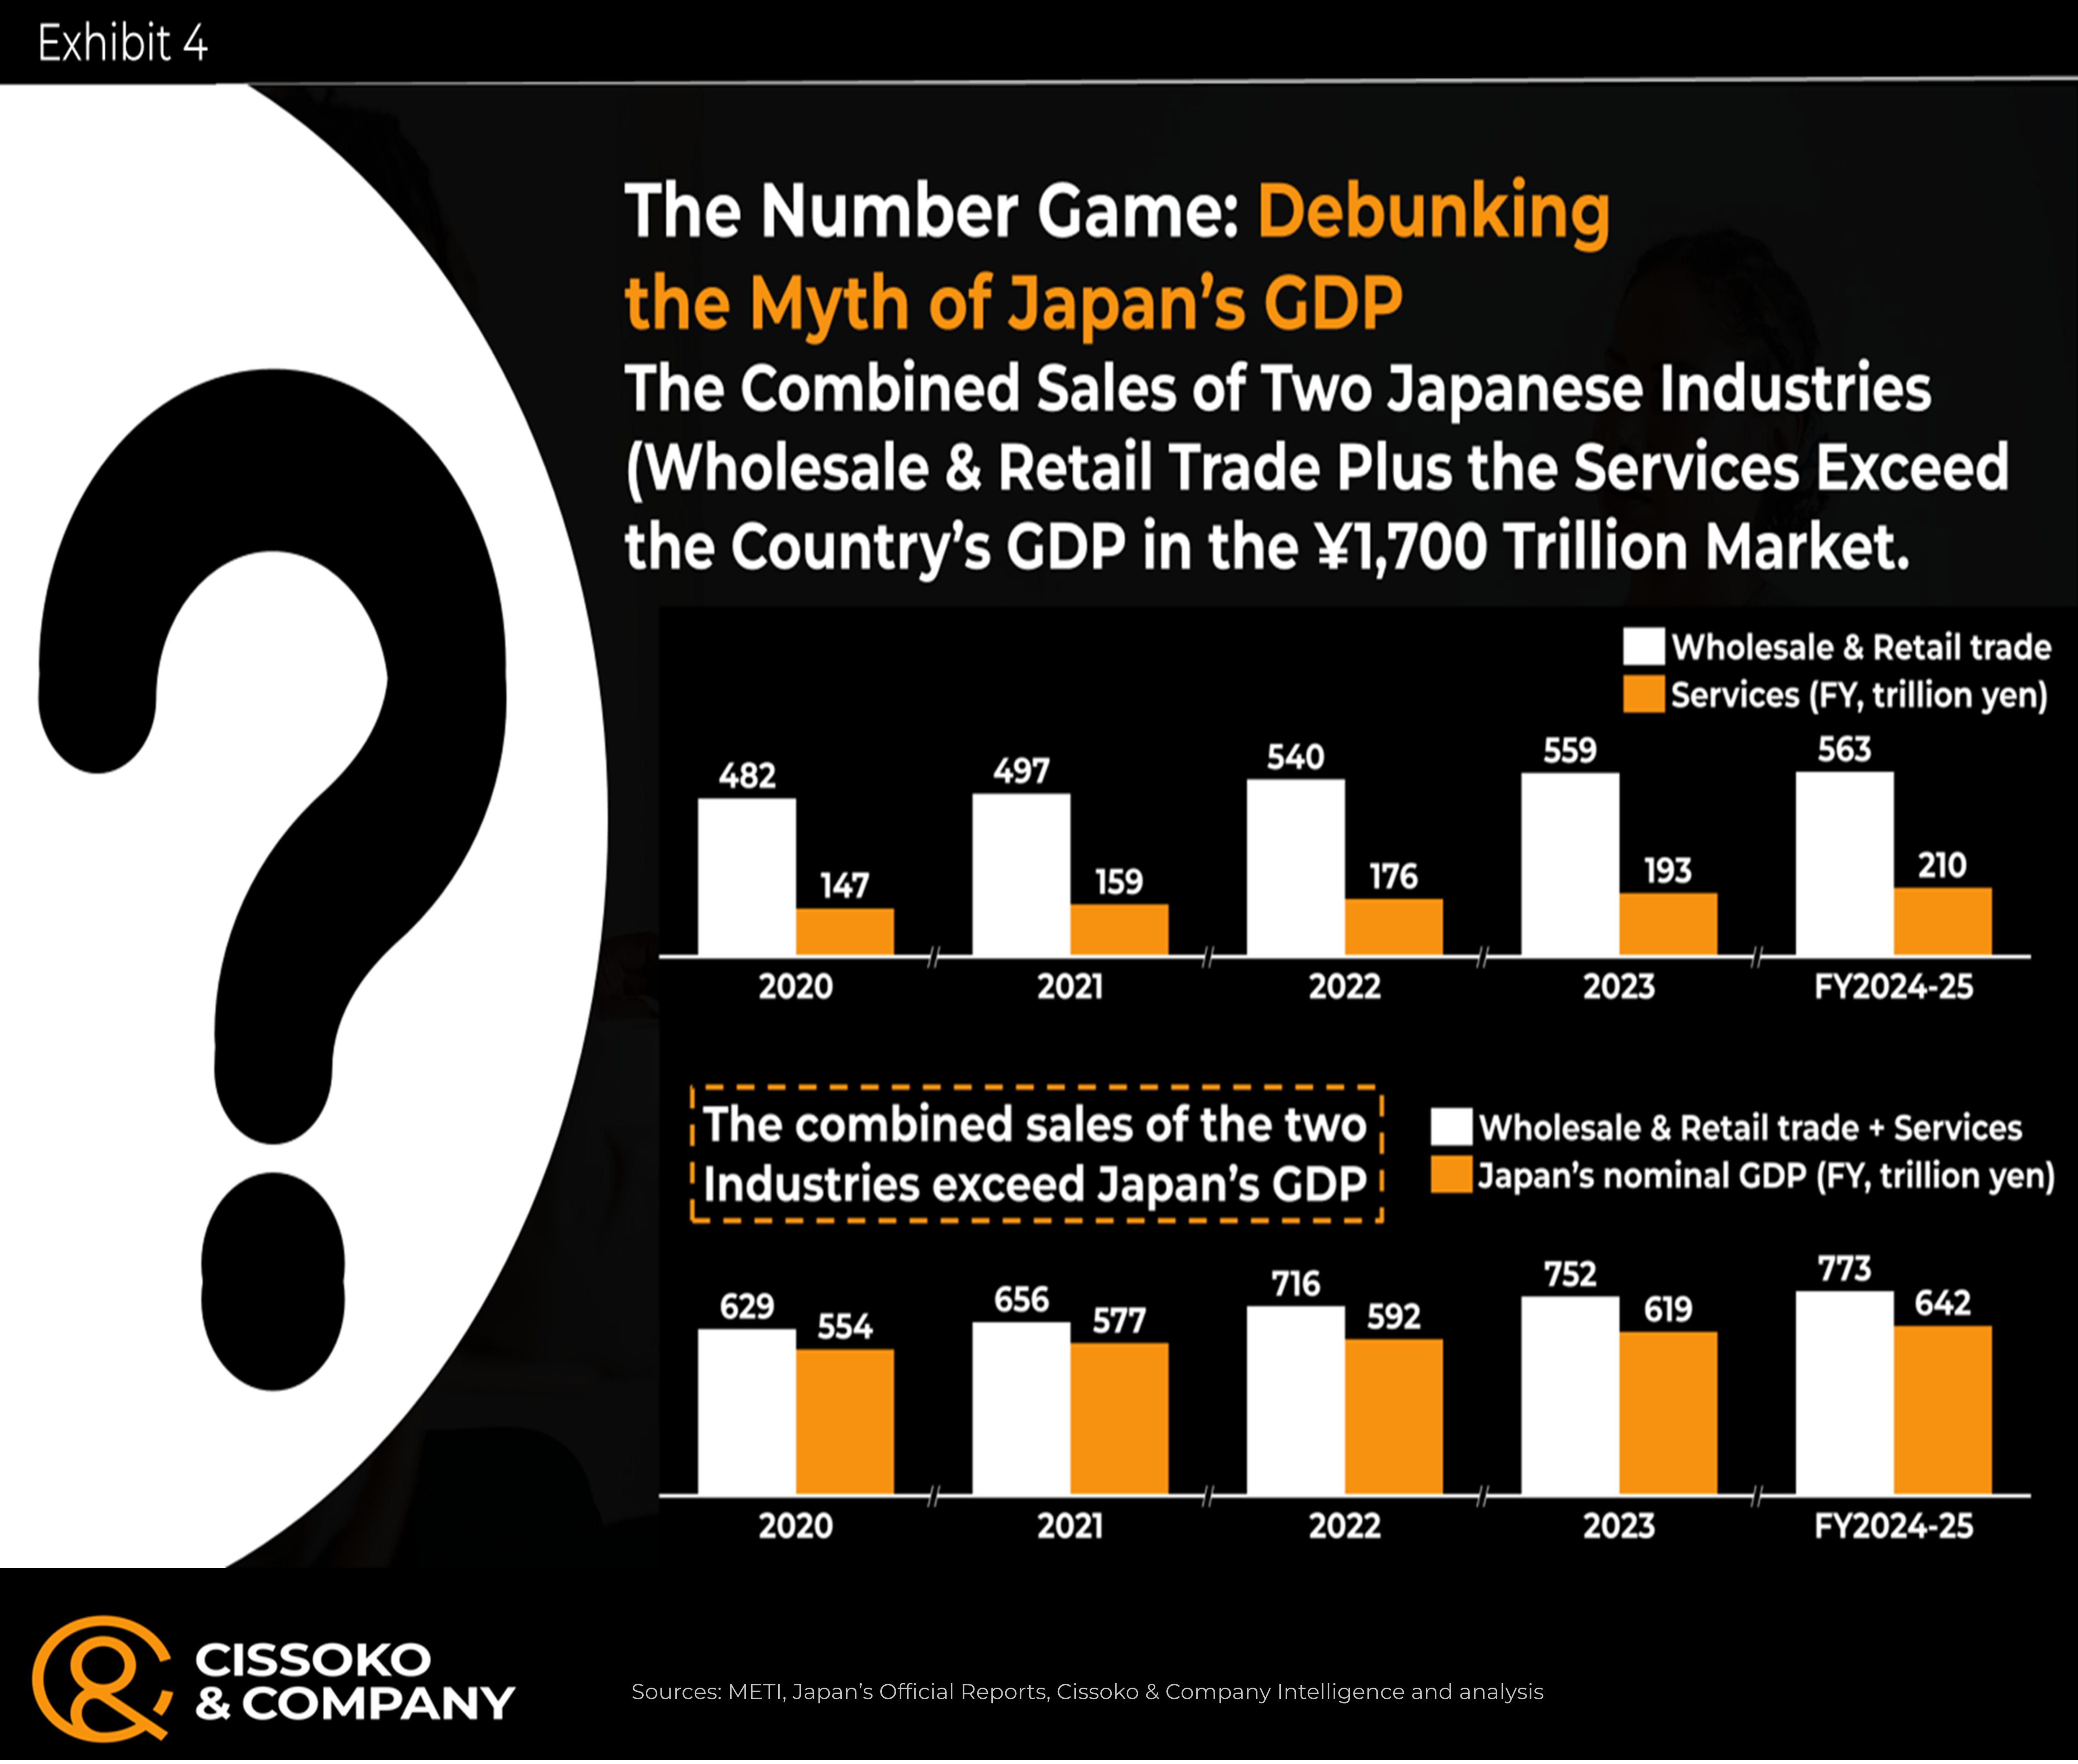
The findings indicated that the aggregated sales figures of these two sectors have exceeded the national GDP in each of the past five fiscal years, within a market valued at approximately ¥1,700 trillion.
The Combined sales of Smaller Japanese Businesses Beat the Country’s GDP
The Japanese economy has produced many household names and corporate giants, many of which are publicly listed. However, it is predominantly composed of micro, small, and medium-sized enterprises, which constitute 99.7% of firms nationwide. Consequently, our investigation focused on small businesses to assess the extent to which their aggregate sales compare with the nation’s Gross Domestic Product (GDP).
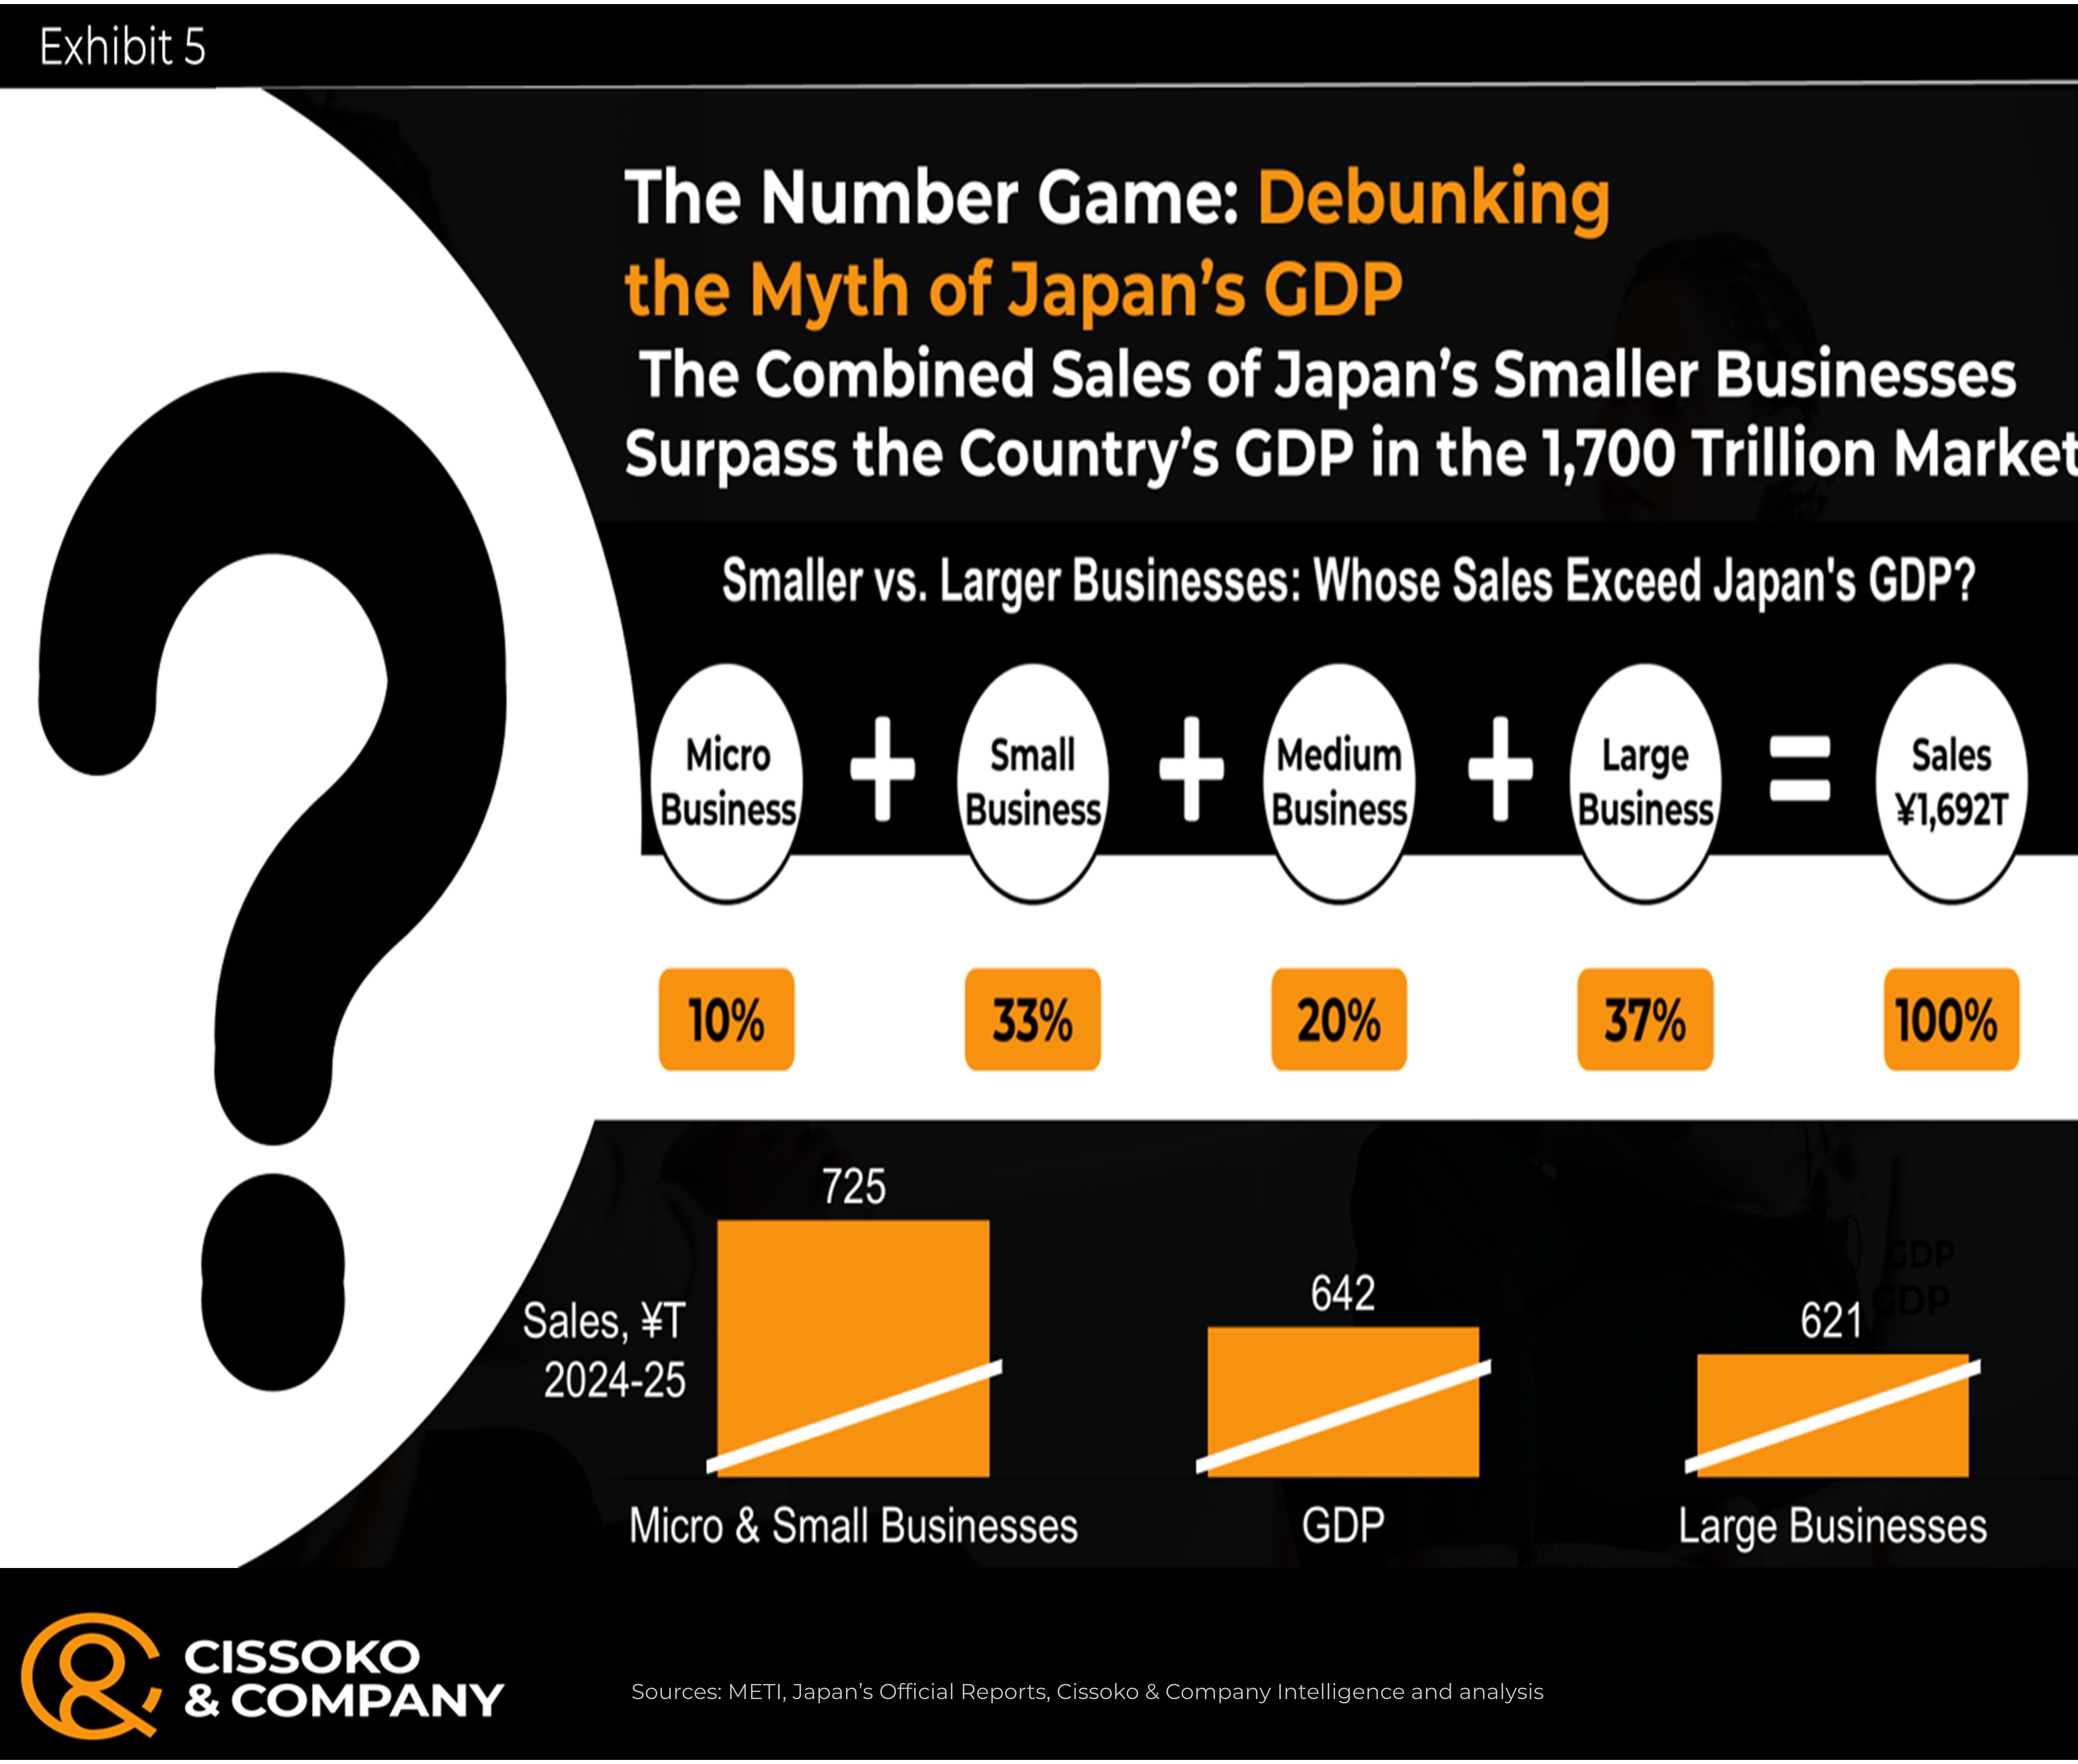
Surprisingly, our analysis showed that smaller Japanese enterprises, rather than larger corporations, achieved sales exceeding Japan’s GDP in fiscal year 2024-25.
In essence, the total sales of Japan’s micro and small businesses exceeded the country’s GDP by nearly 13%. This represents an additional economic strength of the Japanese economy that remains largely unrecognized by most economic commentators, particularly in their often-alarmist discourse on Japan’s economic competitiveness.
Japan’s Sales per Capita are More Than Twice the Country’s GDP per Capita
Japan’s gross domestic product (GDP) per capita, like that of other nations, is routinely cited as an indicator of national affluence. Regrettably, due to widespread unfamiliarity with the computation of per capita GDP, many erroneously equate it with a nation’s per capita sales, which are derived from gross output (total sales) and seldom feature in news headlines. Given that GDP has traditionally been regarded as the primary measure of a country’s economic output or the sole focus of economic analysis over the decades, there appears to be little incentive to scrutinize alternative metrics.
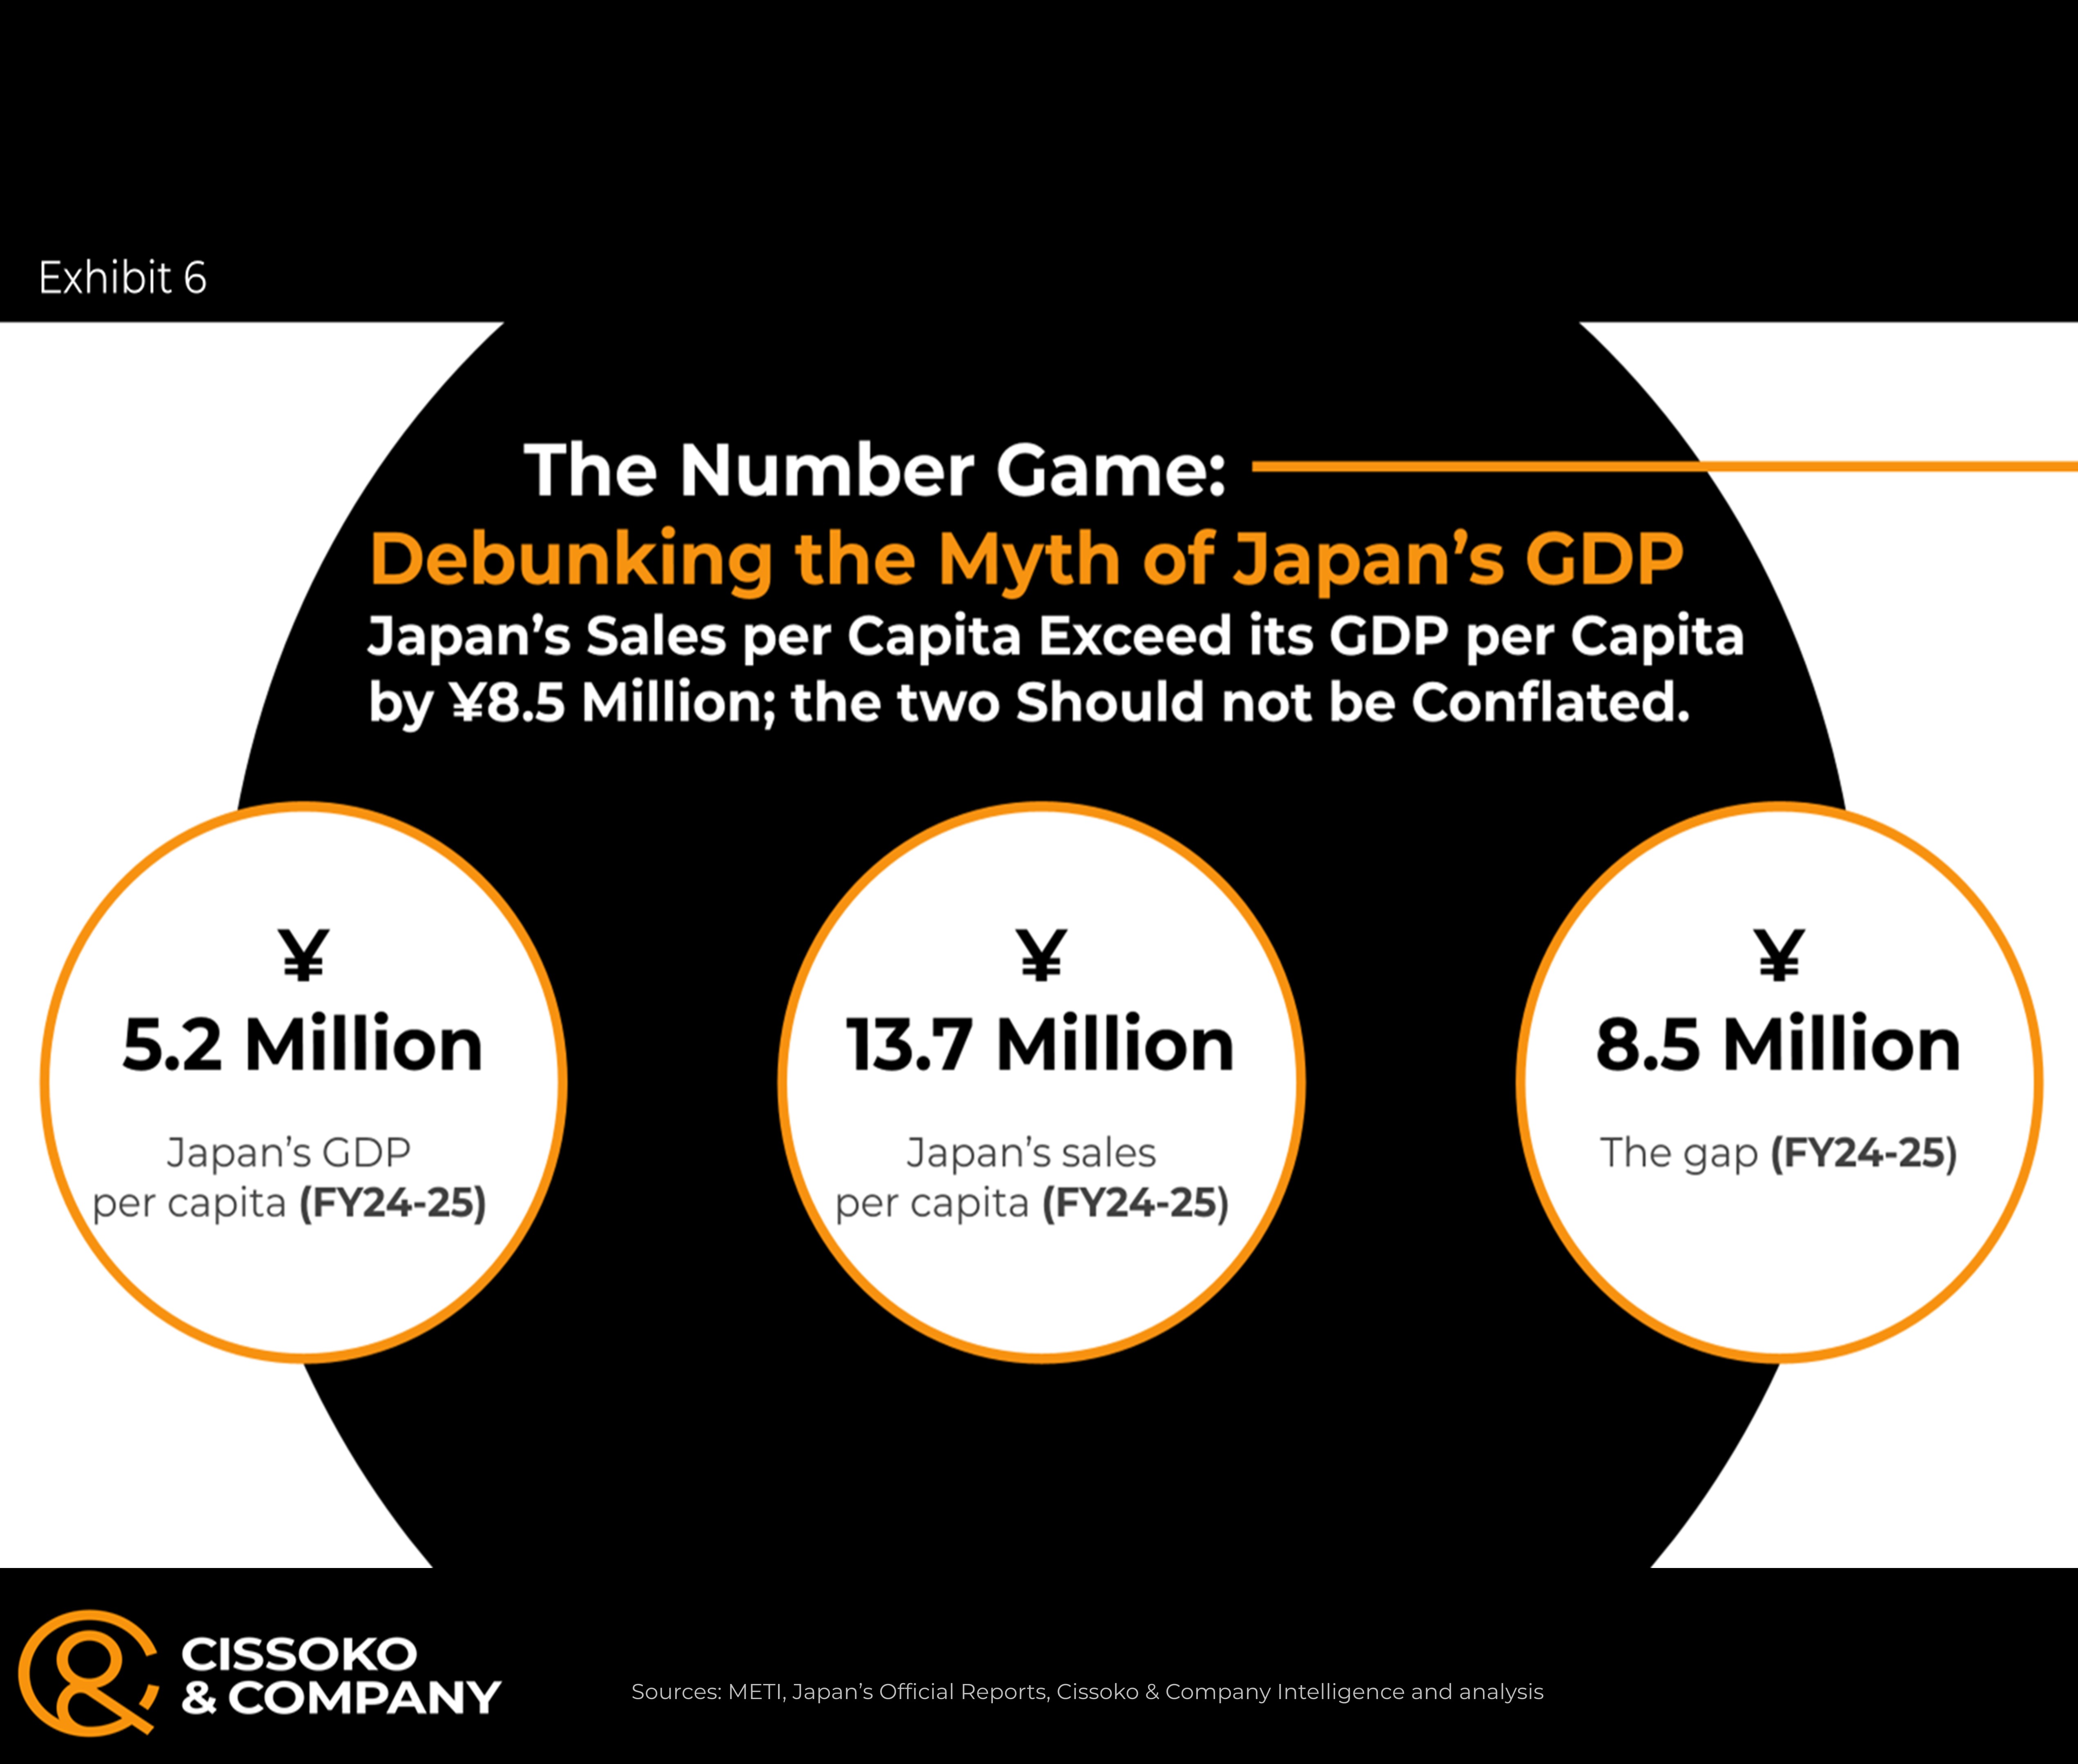
Consequently, an investigation was undertaken to compare Japan’s GDP per capita with its sales per capita. The findings indicate that for fiscal year 2024-25, Japan’s GDP per capita was approximately ¥5.2 million, while sales per capita were ¥13.7 million, representing a discrepancy of more than 160% between these two economic indicators.
The commercial implication of this analysis is that over many years, conflating countries’ per capita GDP with per capita sales has led numerous business leaders astray. Specifically, in Japan’s context, while GDP per capita might suggest an economy in distress or a limited market with scant business opportunities, sales per capita more accurately reflect Japan’s economic strength.
The Race Between Japan’s GDP and its Gross Output (Total Sales)
Japan’s gross domestic product (GDP), like that of other nations, is a fraction of domestic sales (gross output). Regrettably, gross output is frequently mistaken for GDP in common discourse. However, this is a misinterpretation, as GDP fundamentally measures the aggregate value added by a nation’s economic activities, encompassing salaries and wages, corporate operating profits, taxes, public levies, including interest, among other components. Consequently, GDP functions as an indicator of national wealth.
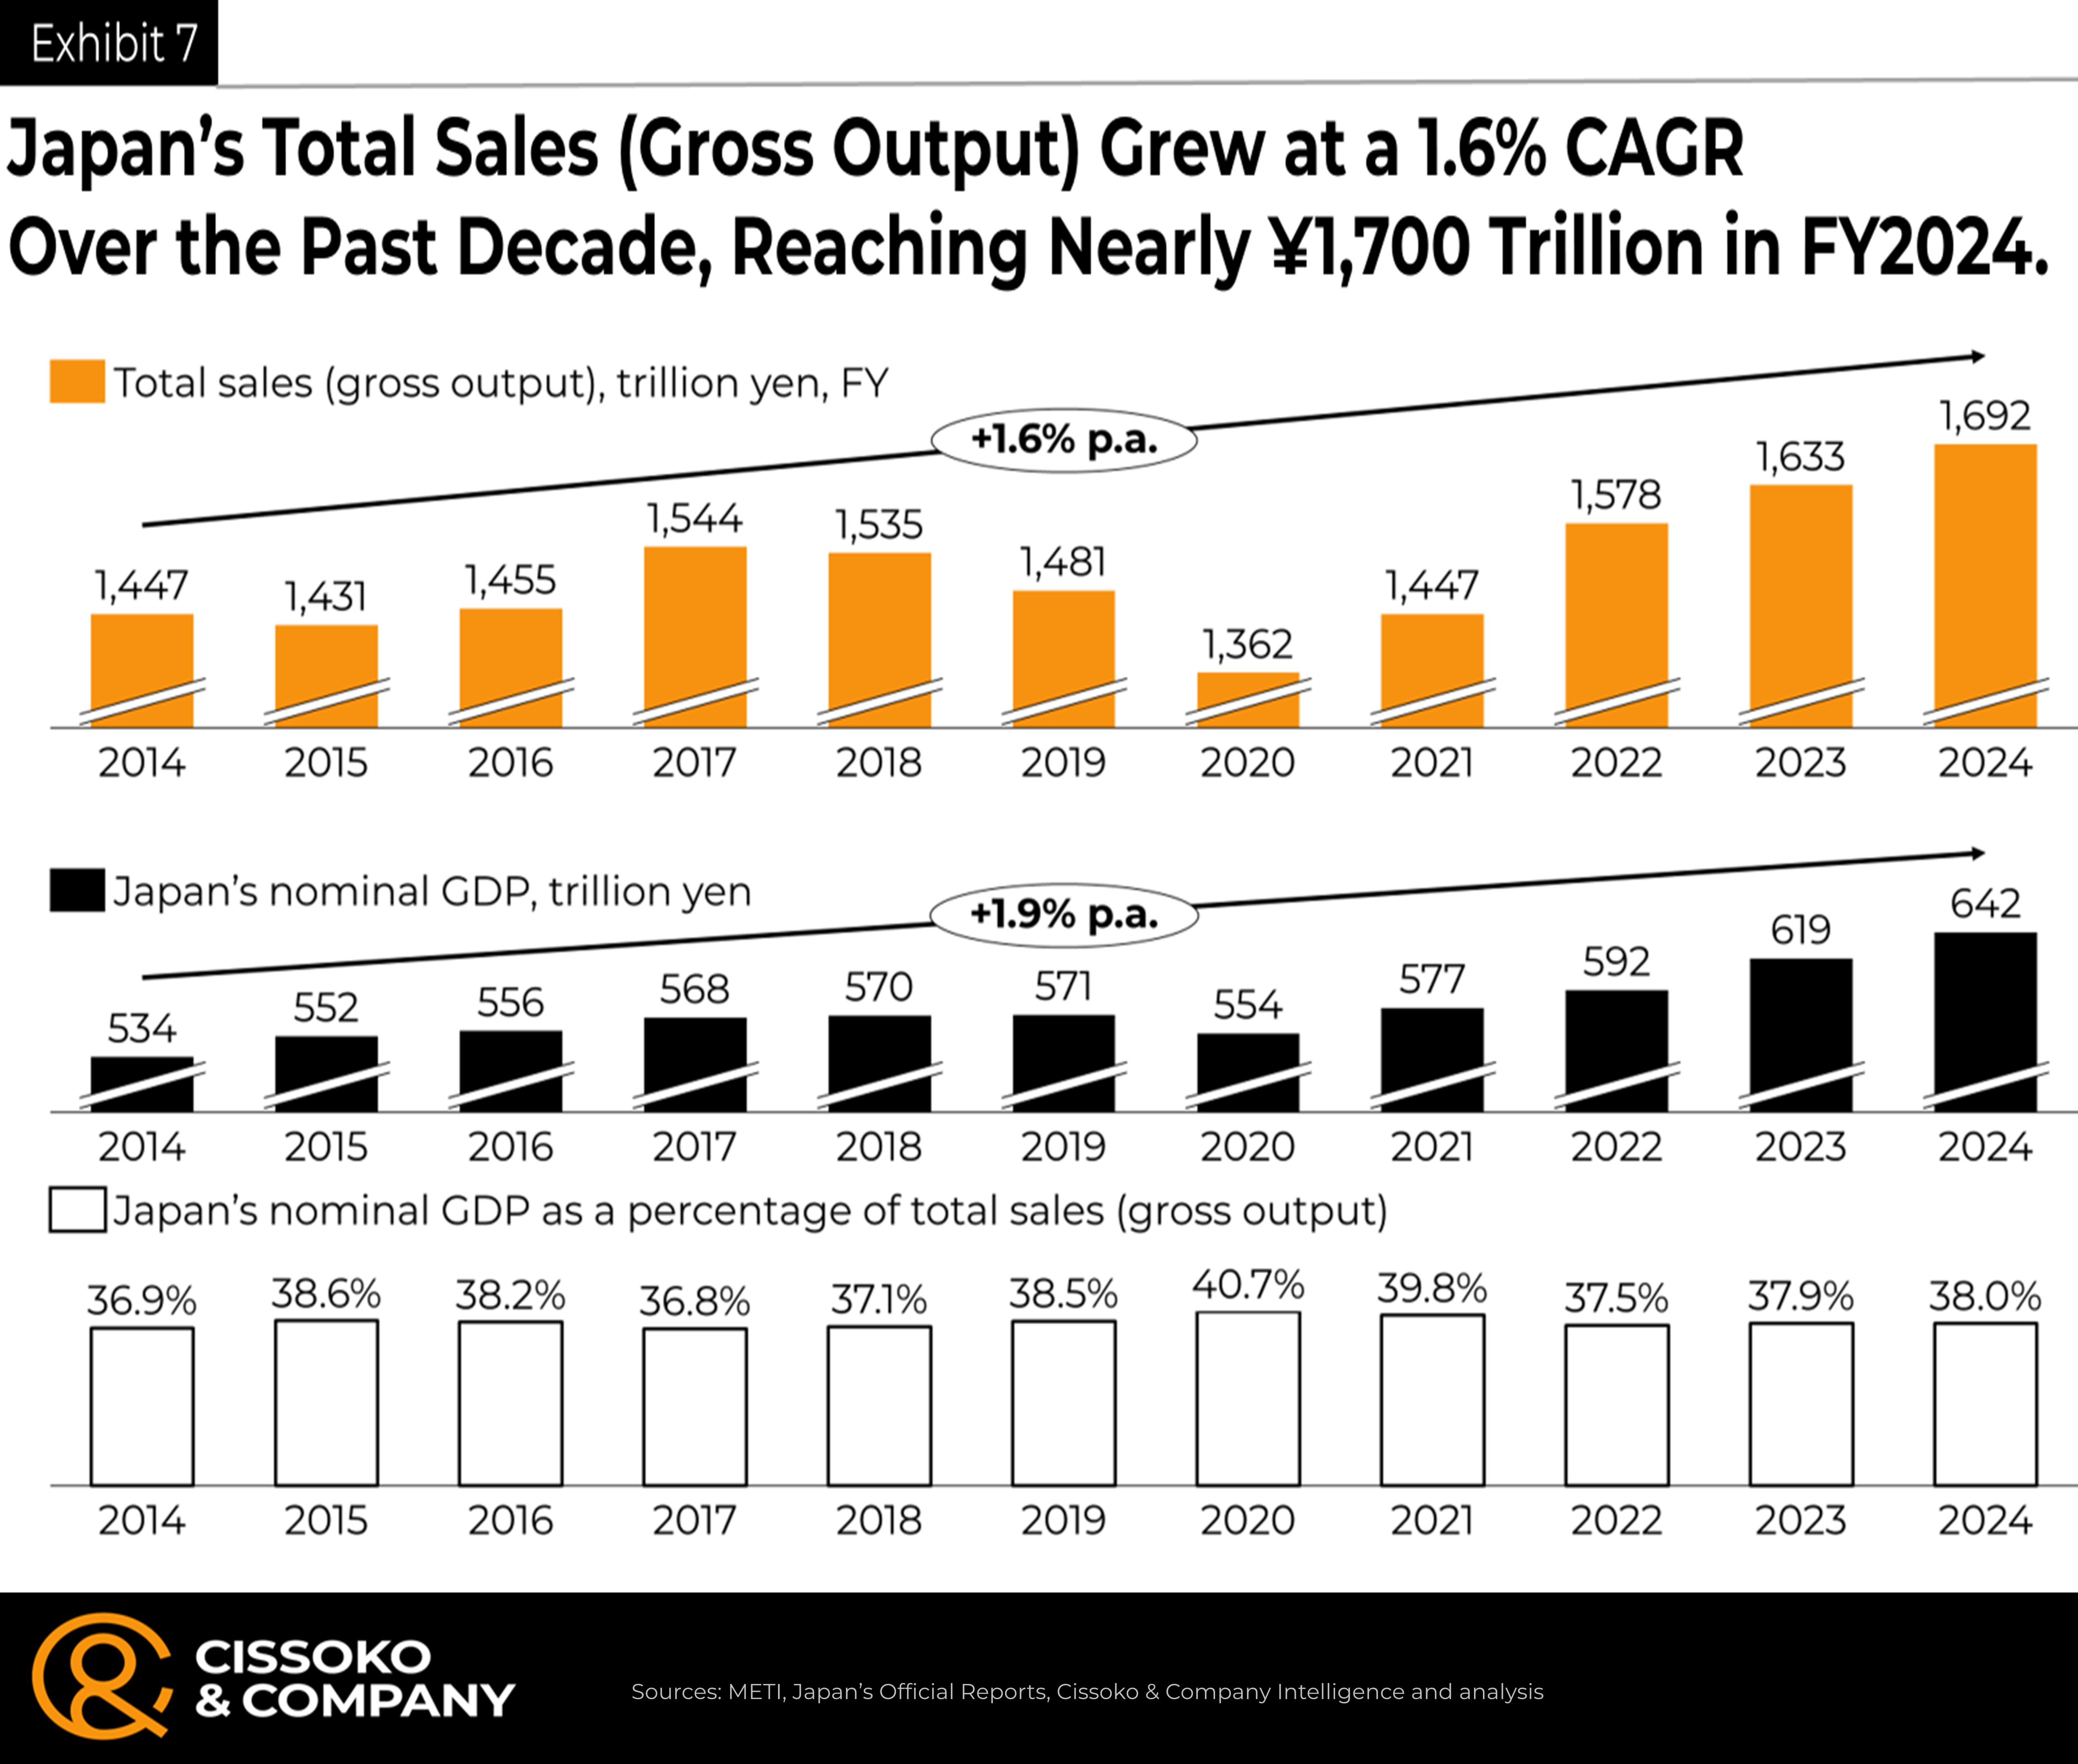
While there are many ways to compute a country’s GDP, they arrive at almost the same number. It is evident through the value-added approach that these figures are largely unrelated to the total sales (gross output) of any country but are instead derived from comprehensive economic output, which includes both business-to-business (B2B) and business-to-consumer (B2C) transactions.
Why Japan’s Household Final Consumption Expenditure is Just a Fraction of the Total Domestic Sales (Gross Output)
Indeed, our experience and related studies have demonstrated that what most individuals refer to as sales or revenue is actually the final consumption of households, commonly termed consumer spending. However, such figures do not account for B2B transactions or sales driven by corporate investments across various nations.
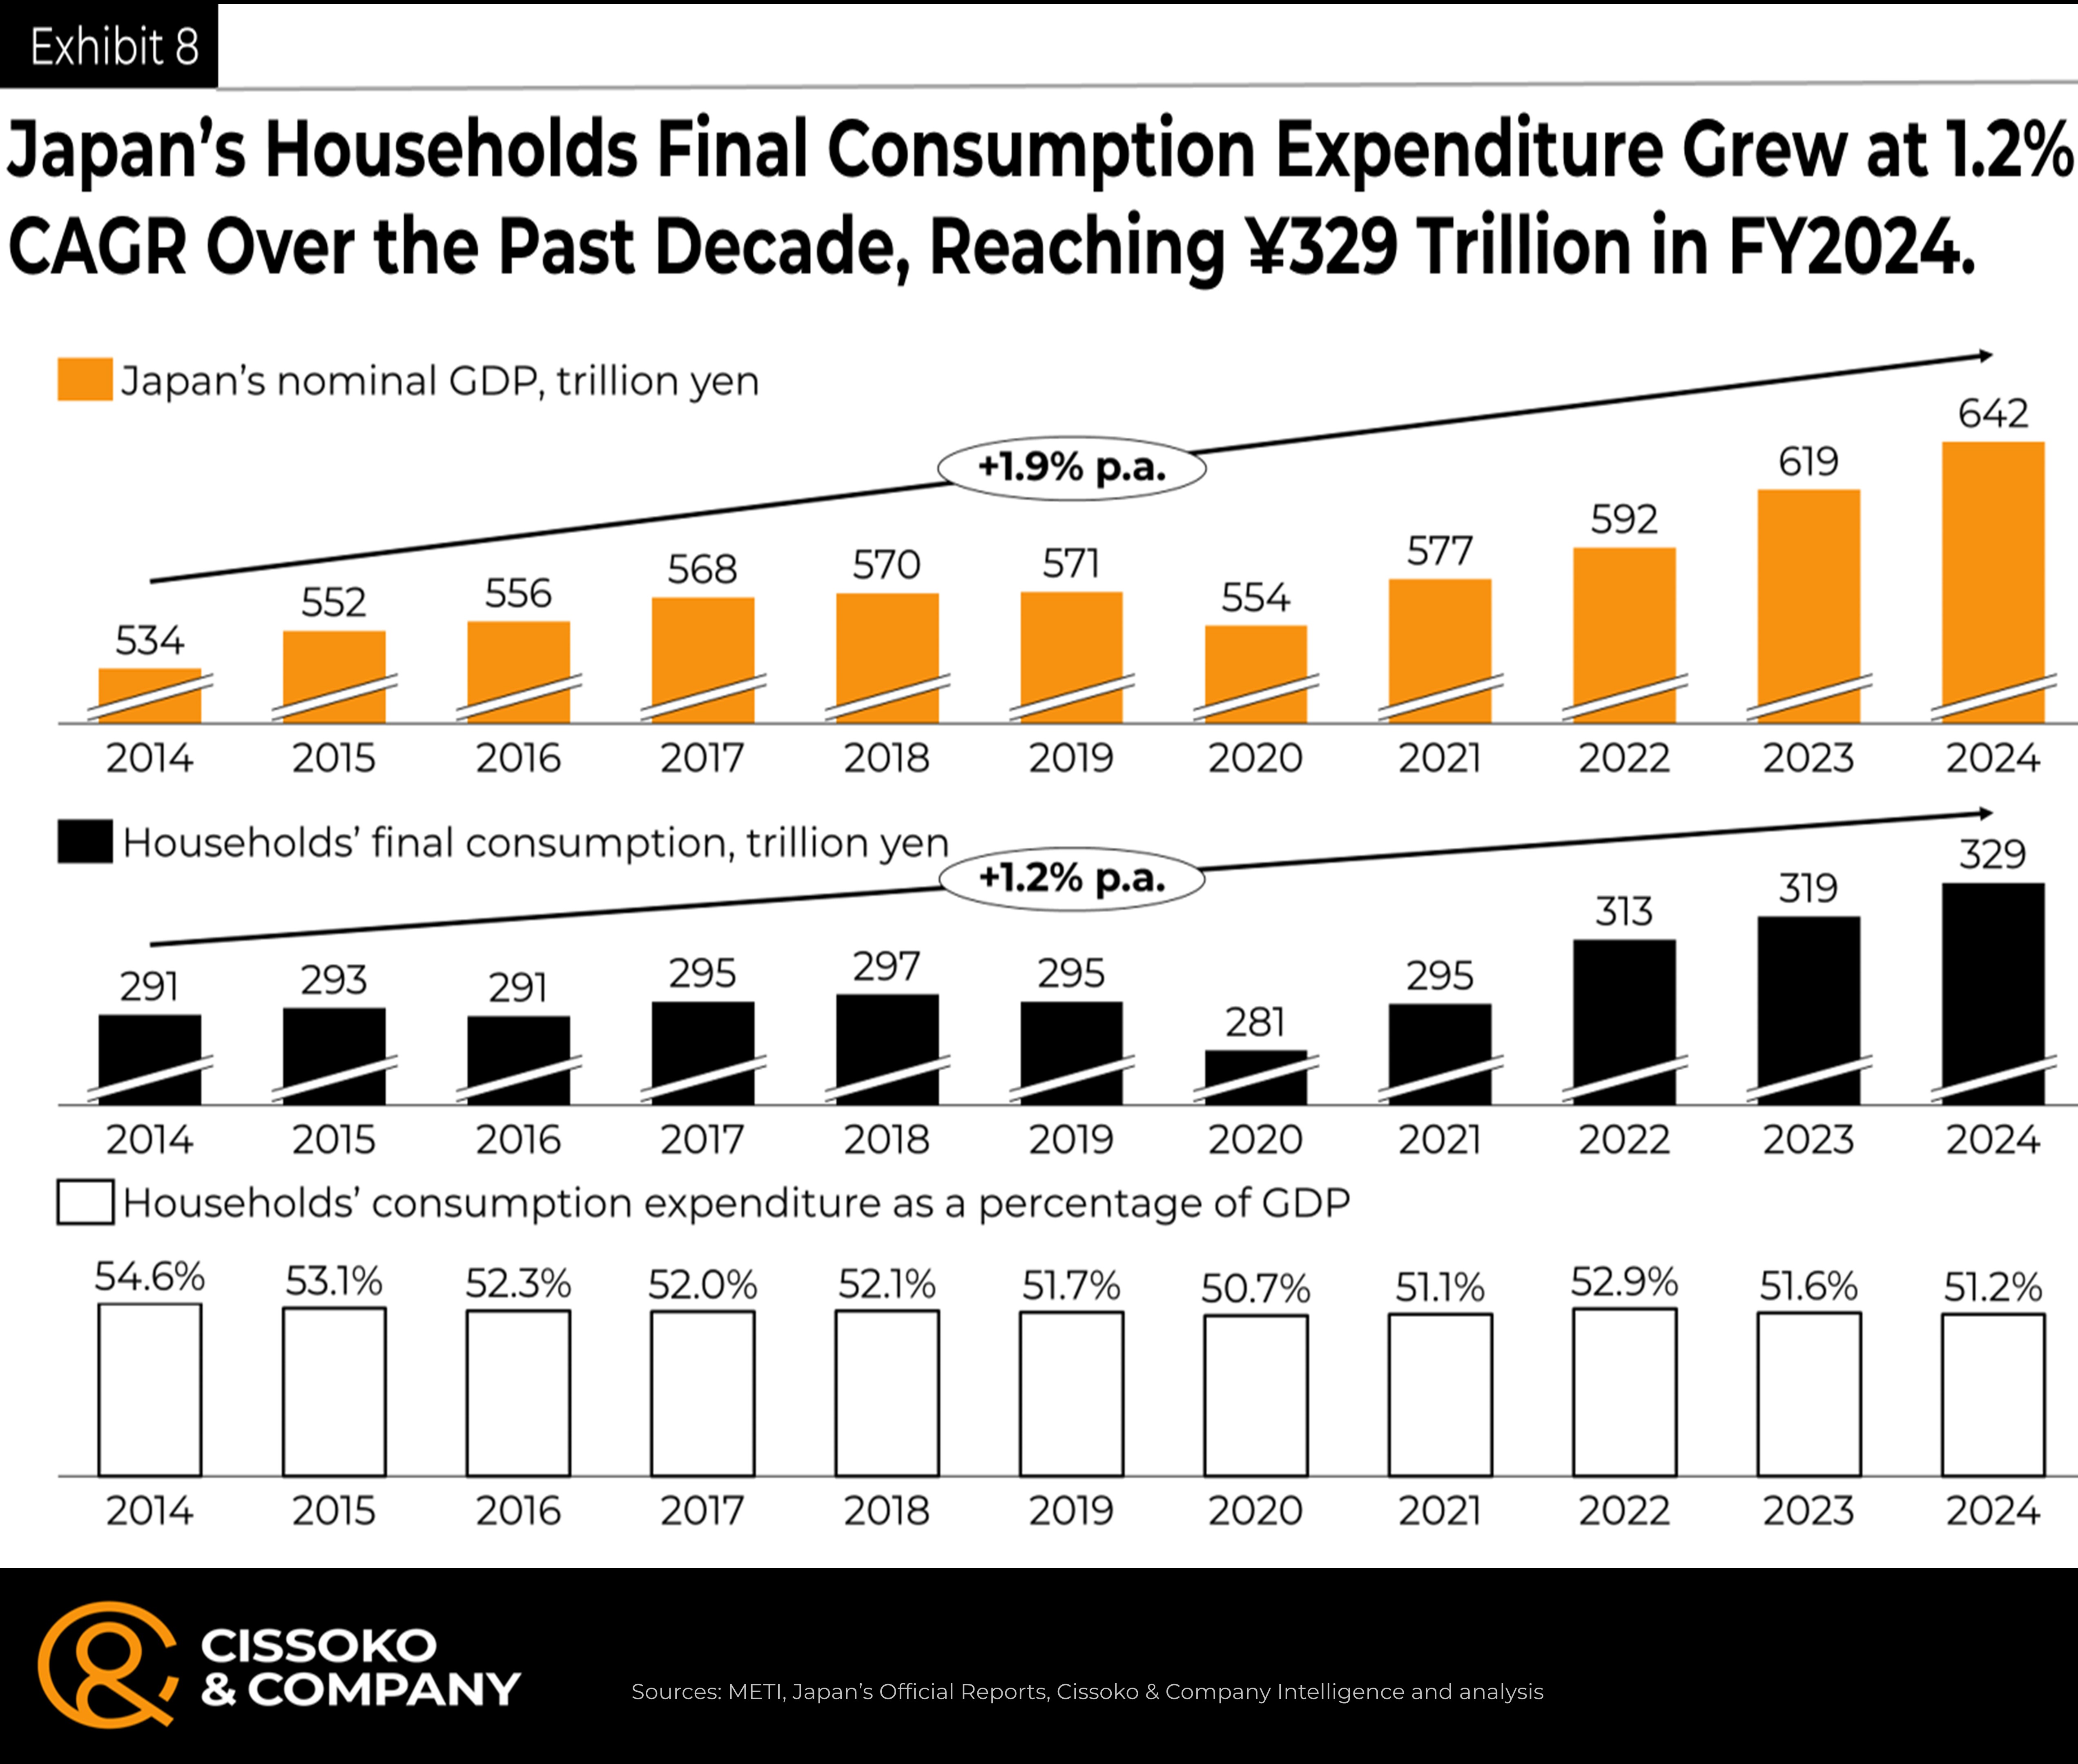
Moreover, many domestic sales transactions are not production-driven but rather trade-related or purely arbitrage-driven, which is markedly different from the final output value of the last production stage, as tracked by GDP through other approaches.
Japan’s GDP and Employee Compensation: Why Does the GDP Get More Attention Than the Gross Output?
The fundamental inquiry emerges: why does Japan’s gross domestic product (GDP), which is considerably smaller than gross output (total sales), attract greater attention and generate significant discussion across news outlets?
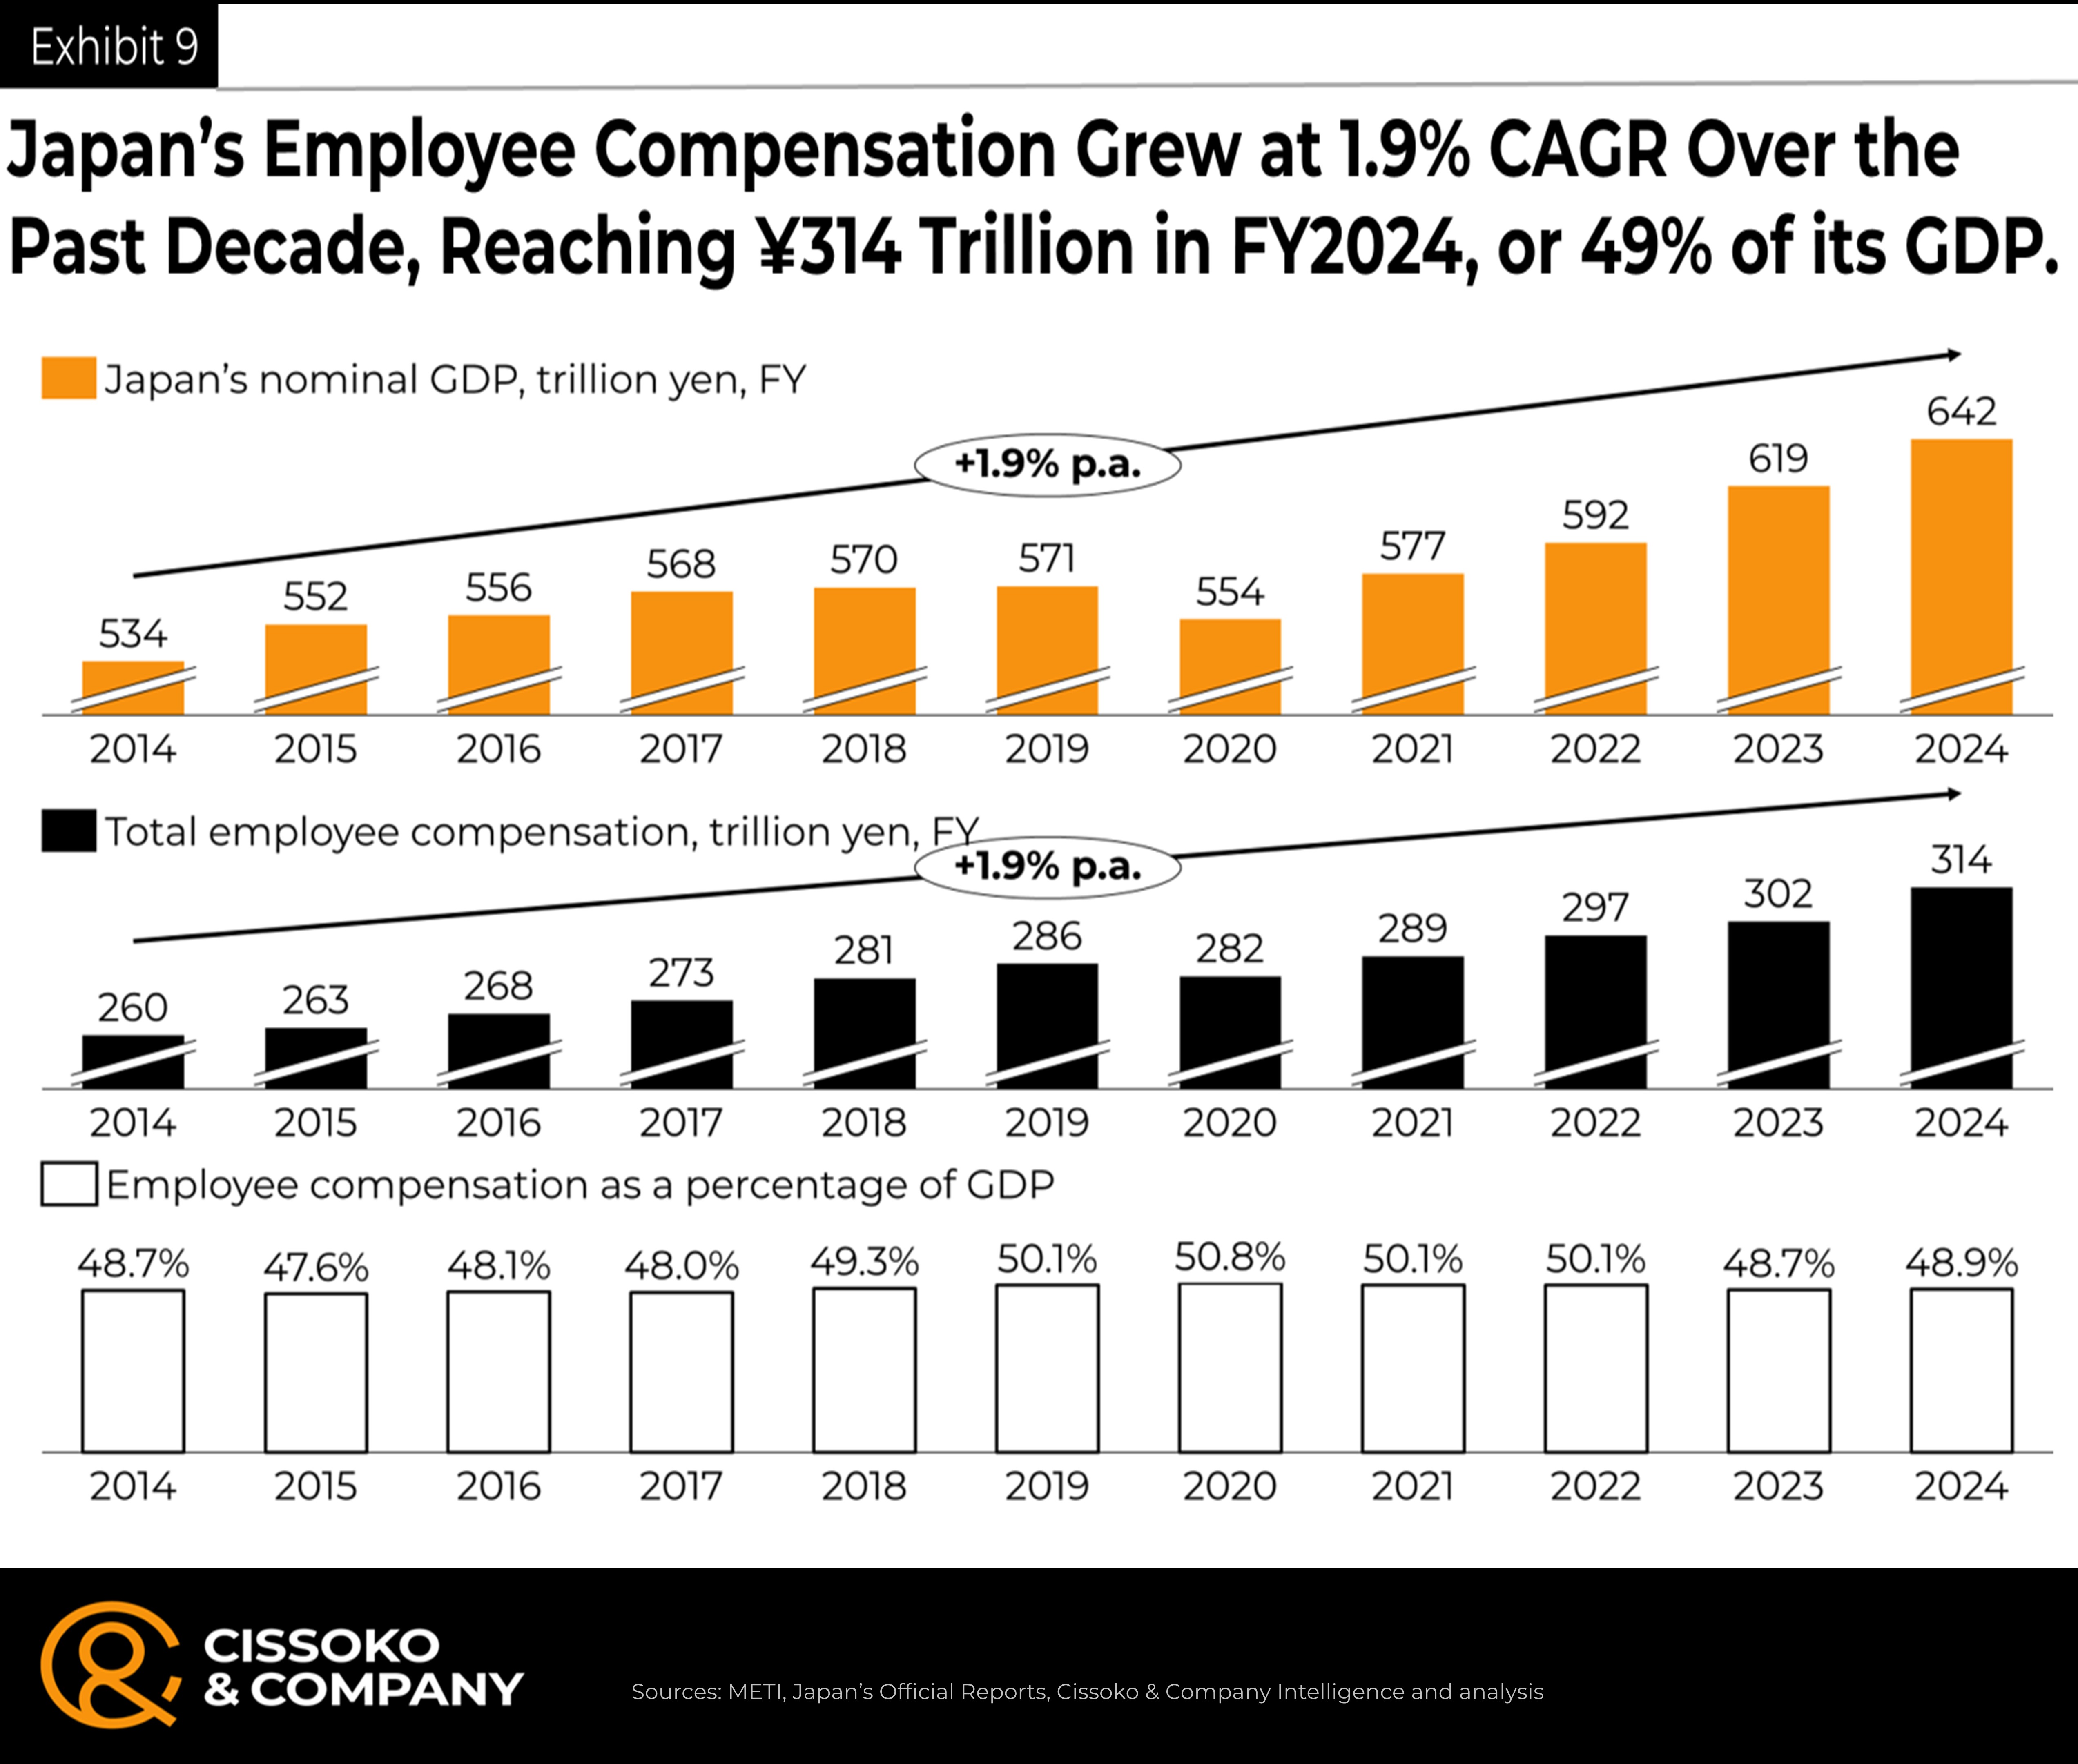
One rationale is its association with employment (productivity), individuals’ salaries, and wages, which together constitute nearly 50%. Therefore, the prominence of GDP is more closely linked to income and productivity rather than total sales across nations, as indicated by gross output, which, regrettably, receives minimal mention in daily news coverage.
Get in Touch
We will respond to your message as soon as possible.
Insights to Win
Subscribe to our newsletter for in-depth analysis, reports, and our perspectives on business and economic issues related to the Japanese market and the global economy.