
Winning in Japan: Japanese Industries’ Profitability Insights — Report 2022

Bluntly speaking, the game of strategy is the game of profitability. As such, a winning strategy must be consistent with the 3Ps of profitability. That is the profitability of sales, the profitability of assets and the profitability of capital. In other words, instead of a single-minded focus on gaining market share (a flawed metric), CEOs and other business leaders need to rethink their strategy games through the lens of profit share. That means refocusing the strategic calculus on a company’s net profit share or operating income share of the entire industry, region, or country. Winning that game, we believe, is one of the hallmarks of a true strategist.
In this report, we will focus on the profitability of sales of Japanese industries and sectors for the fiscal year 2021 (April 2021 to March 2022). In other words, our analysis will center on the operating and ordinary profit margins of all industries and sectors in the Land of the Rising Sun. For one, we believe that C-Suites and boards—Japanese or foreign—need these granular insights to craft a winning strategy.
For one, as the disruption from supply chains persists, compounded by the Omicron variant, rising inflation and looming recession, firms’ profitability within an entire industry comes into question. Furthermore, in this age of purpose, companies must double down on diversity and inclusion in addition to other ESG priorities.
Total Ordinary Profit Pools of all Japanese Industries
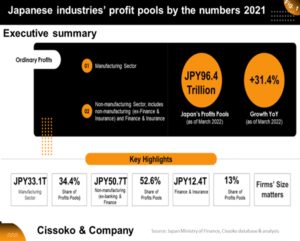
Compared to 2020, when COVID-19 disrupted the global economy, in 2021, the ordinary profit pools of all Japanese industries jumped 31.4% to ¥96.4 trillion, driven by the manufacturing sector with its share of the profit pools growing 15% to ¥33.1 trillion over the previous year.
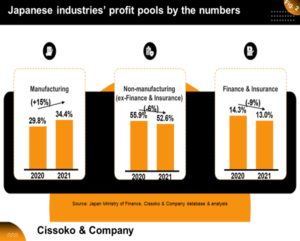
Yet the two segments of the non-manufacturing sector-manufacturing sector (ex-finance and insurance) and Finance and Insurance saw their share of their total ordinary profit pools declining by 6% and 9%, respectively. However, some industries are leading the pack regarding each industry’s share of the total ordinary profit pools.
Profit Pools Leader Across Japanese Industries and Sectors
Our analysis revealed seven Japanese industries that stood out because their share of the total national industries’ profit pools was above the national average.
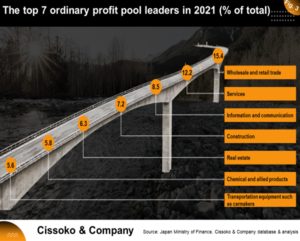
The exclusive league, led by the wholesale and retail industry, grabbed 15.4% of the total ordinary profits made by Japanese sectors in 2021, followed by the service industry with 12.2%, while the information and communication industry (IT) took the third spot with 8.5% of the total ordinary profits.
Industries with the Highest Profit Margins in the Non-Manufacturing Sector
In the non-manufacturing sector, excluding finance and insurance, four industries lead the pack with their share of the non-manufacturing sector’s ordinary profit pools in the competitive Japanese market, where the odds are stacked against foreign CEOs.
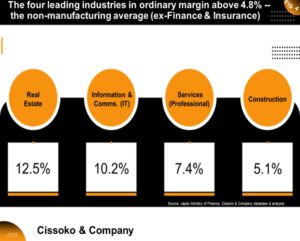
Japan’s real estate industry leads the way with 12.5%, followed by the IT industry, which grabbed 10.2%, then services at 7.4%. Finally, the construction industry has a profit margin slightly above the average of 4.8%.
Industries with the Highest Ordinary Profit Margins in the Manufacturing Sector
Unlike the non-manufacturing sector (ex-finance and insurance), many industries in Japan’s manufacturing sector have higher ordinary profit margins. At the top of the high-profit margin league is the group of industries called chemical and allied products, including Japanese pharmaceutical firms, cosmetics, and detergent makers.
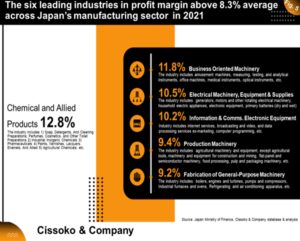
The industry has an ordinary profit margin of 12.8%, followed by the business-oriented machinery industry with 11.8%. Like the previous industry, it includes industry segments such as amusement machine makers (pachinko), measuring, testing, and analytical instrument makers.
Companies’ Size Does Matter in Japan’s Profitability Race
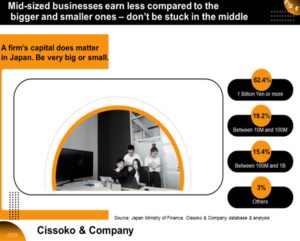
Our analysis revealed that medium-sized firms earn less than their bigger and smaller counterparts. In other words, corporations with capital of ¥ 1 billion or more have 62.4% of Japan’s total ordinary profit pools, followed by the smaller ones with 19.2%. At the same time, companies stuck in the middle with capital between ¥100 million and ¥ 1 billion are left in the dust when competing for industries’ profit pools.
In short, this report provides business leaders and CEOs with insights and trends shaping the Japanese market and its profitability landscape in this age of inflation, supply-chain disruption, and rising interest rates worldwide.
Get in Touch
We will respond to your message as soon as possible.
Insights to Win
Subscribe to our newsletter for in-depth analysis, reports, and our perspectives on business and economic issues related to the Japanese market and the global economy.