
The Money® Game™ Matrix: The New Corporate Strategy and M&A Playbook
For decades, if not centuries, the assumption has been that a profitable firm with profit margins above the industry average is a winning firm. However, our research exposes critical flaws within Japan and the broader global economy, shifting CEOs’ focus toward a more nuanced understanding of success: mastering the Money® Game™. This insight has profound implications for mergers and acquisitions (M&A), corporate strategy, and private equity.
At its core, winning in strategy means winning the Money® Game™. While various paths —technology, talent, culture, or customer experience — can lead to value creation, the ultimate objective remains the same: capturing a larger share of the total profit available across industries and national economies. This principle holds true not only in Japan but across the globe.
The Money® Game™ Model dismantles the long-held belief that high profit margins alone signal success. Traditional markers, such as profitability of sales, assets, and capital (the 3Ps of profitability), are no longer reliable indicators of a winning firm or industry. Instead, true success lies in sustaining profit growth at a compound annual growth rate (CAGR) that surpasses that of the broader industry or economy, regardless of profit margins.

Contrary to popular belief, over half of companies that achieve profitability according to the 3Ps are still losing the Money® Game™. Their compounded total profit growth lags behind their industry’s total profit growth CAGR, meaning their share of the overall profit is shrinking over time. This has significant consequences for corporate strategy, M&A activity, and private equity investments.
Ultimately, our shared goal is to see GDP grow, a process built on five key pillars, with corporate net income as the most important in the context of the Money® Game™. Winning in strategy is not simply about growth but ensuring that an industry’s net income growth CAGR outpaces national corporate net income growth. Similarly, an industry is deemed successful when its total operating profit growth CAGR exceeds that of the national economy.
The concept of “Winning the Money® Game™” injects a thrilling competitive dynamic into the discussion. When an industry’s total net income or operating profit growth CAGR surpasses the national growth rate, it clearly indicates victory in the Money® Game™. Industries meeting these criteria aren’t merely growing—they are actively claiming a larger share of the nation’s total profits. This principle applies not just to industries but to individual firms, as demonstrated by comparing a firm’s total profit growth CAGR with its industry. In essence, winning the strategy game means Winning the Money® Game™.
To exemplify the Money® Game™ Matrix within the Japanese context, we will analyze four Japanese industries across the quadrants of Japan’s 120 trillion yen Money® Game™—the total ordinary profit generated in Japan during FY 2022-23, which saw more than 10% growth compared to the previous year.
Additionally, each selected industry will be examined over the fiscal period from 2017-18 to 2022-23, concluding on March 31, 2023. This analysis will measure each industry’s compounded annual total profit growth rate against Japan’s compounded national ordinary profit growth rate during the same period while considering each industry’s ordinary profit margin. Our research has revealed a fundamental truth: it’s not the operating or ordinary profit margin determining success in the Money Game; the most critical factor is the compounded total profit growth rate.
For instance, industries with low profit margins can still win the Money® Game™ by maintaining strong, sustainable demand for their low-margin products or services. Their resilience in the face of fluctuating profit margins allows them to capture an increasing portion of the total profit pool. In short, the key to winning the Money® Game™ is sustained compounded profit growth rate, not just margin performance.
Applying the Money® Game™ Matrix
For a systematic comparison, two critical metrics are essential: the industry’s or firm’s operating, ordinary, or net profit margin, and its total compounded annual profit growth rate (CAGR) over a defined period, such as five or ten years. With these numbers, you can place each industry or firm in the appropriate quadrant of the Money® Game™ Matrix. This provides a clear framework for evaluating performance.
For analysts aiming to determine whether an industry or company is winning the Money® Game™, focusing solely on the total annual profit growth CAGR can offer valuable insights. A positive CAGR indicates growing profits, while a negative one reveals shrinking profits. This simple calculation allows for a quick assessment of whether an industry or firm is expanding its share of total profits or falling behind.
Case Study 1: Difference between low-margin industries
Take Japan’s steel industry, for example. Despite its relatively low profit margins compared to the real estate sector, the steel industry has experienced substantial growth in total profit, placing it at the winning table in Japan’s Money® Game™ in recent years. Over the past five years, the industry’s total profit doubled to ¥1.4 trillion, driven by a strong compounded annual growth rate (CAGR). This demonstrates that even with lower profit margins, the steel industry has successfully increased its share of national profits.
In contrast, despite having similarly low margins compared to the national average, Japan’s electricity production and distribution (energy) industry has seen its total profit growth rate (CAGR) fall behind the national average. As a result, it stands as one of the biggest losers in Japan’s Money Game. The industry found itself in the worst of both worlds: lower profit margins and a negative total profit growth rate. By March 31, 2022, the industry’s hard-earned ordinary profits evaporated, with more than ¥400 billion in losses.
Case Study 2: Difference between high-margin industries
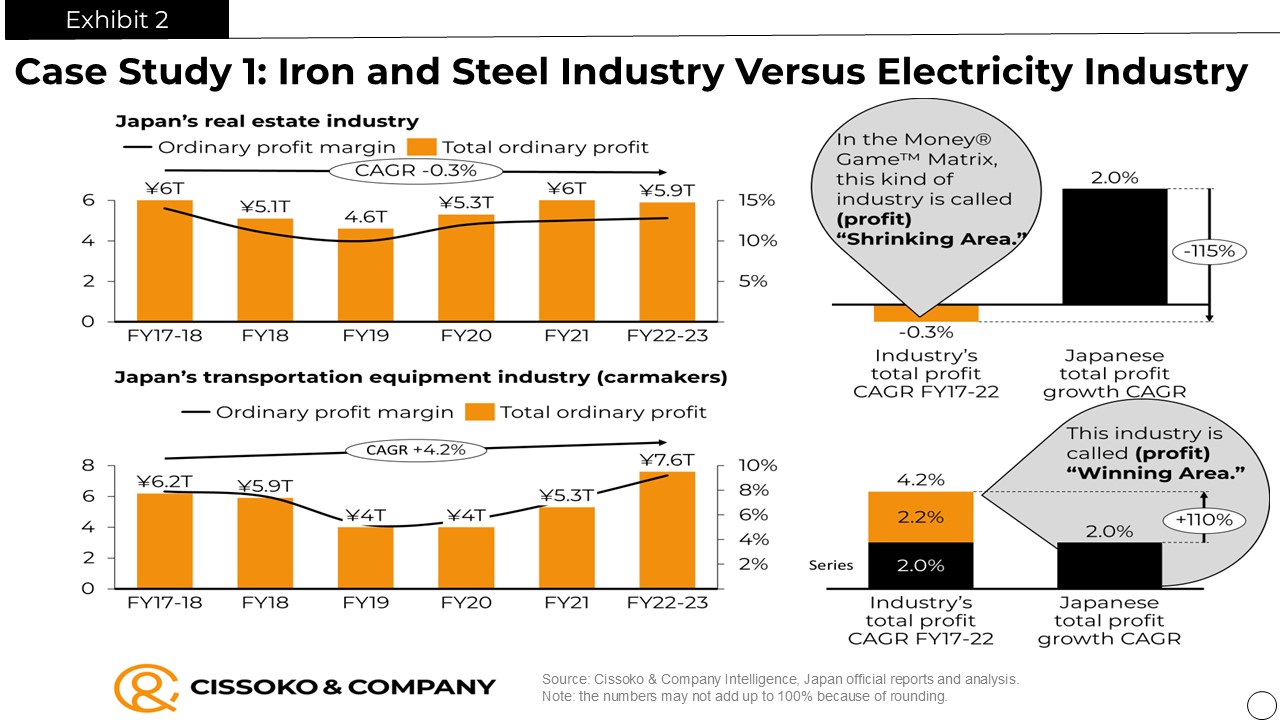
Japan’s real estate industry has led in operating and ordinary profit margins for many years, consistently hitting 10% or more. However, these high margins can be misleading for those unfamiliar with the intricacies of the Money® Game™. Profit margins alone do not provide a complete strategic picture. A second critical metric is needed: the industry’s total compounded profit growth rate (CAGR), whether in operating, ordinary, or net profit. By examining these two metrics, strategists can gain deeper insights into an industry’s competitive positioning.
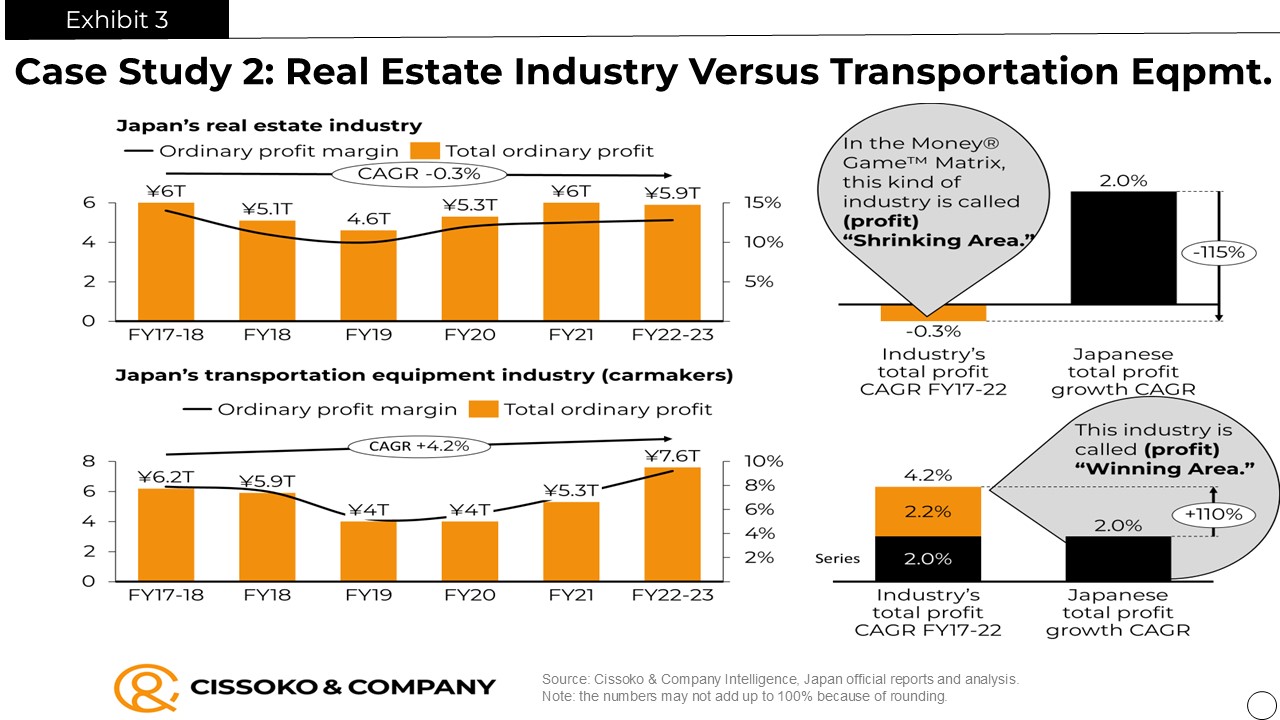
A closer look at Japan’s industries reveals that despite its high margins, the real estate industry lost the Money® Game™ over the six years ending March 31, 2023. Its total ordinary profit CAGR fell to -0.3%, compared to Japan’s national growth of 2%. This negative growth means that the real estate industry’s share of the national profit pool has been shrinking despite impressive profit margins. We refer to industries in this position within the Money® Game™ Matrix as residing in the (profit) “Shrinking Area.”
Conversely, over the same period, Japan’s transportation equipment (carmakers and their suppliers, etc.) industry had an excellent ordinary profit margin compounded by its 4,2% total profit growth CAGR, which stood tall above the nation’s. As such, its share of the country’s overall profit increased dramatically, ultimately winning the Money® Game™. We refer to industries in this category within the Money® Game™ Matrix as residing in the “Winning Area.”

Conversely, when an industry maintains an above-average profit margin alongside a total profit CAGR exceeding the national average, it significantly boosts its share of national profits. Industries in this position are not only growing but also capturing an ever-larger portion of the country’s total profits. We classify these industries as occupying the “Winning Area” of the Money® Game™ Matrix. Over the past six years, industries such as money lending, chemicals, and pharmaceuticals have consistently held a place in this quadrant, demonstrating their strong ability to win the Money® Game™ by achieving high profit margins and sustained profit growth.
Winning the Money Game as a Firm at the Industry Level
The same rules of the Money® Game™ apply to firms across industries, though the benchmark varies. At the national level, the key metric is the total national profit growth CAGR. However, the benchmark shifts to the industry’s total profit growth CAGR for firms competing within an industry. To win the Money® Game™ at this level, a company must consistently achieve a total profit growth CAGR that exceeds its industry’s, regardless of whether its profit margin is high or low.
Case Study 3: Japan’s Finance and Insurance Industry Segments
While traditionally a high-profit-margin sector, the finance and insurance industry offers deeper insights into the Money® Game™ through the lens of compounded annual profit growth (CAGR). Analyzing each segment’s profit growth CAGR against the industry’s total ordinary profit CAGR of -1% over the period provides a clear picture of how different segments perform in the Money® Game™.

The analysis for FY2017-23 revealed the following CAGR figures for various segments:
- Banking: 0% (above the industry’s -1%)
- Money Lending Business: 7% (above the industry’s -1%)
- Financial Product Dealers: -10.6% (below the industry’s -1%)
- Futures Dealers: -9.7% (below the industry’s -1%)
- Life Insurance: -1.6% (below the industry’s -1%)
- Non-life Insurance: 0% (above the industry’s -1%)
- Miscellaneous Insurance: 0% (above the industry’s -1%)
This segmentation highlights the varying levels of success among different players within the finance and insurance industry. The Money® Game™ Matrix is a powerful tool for corporate strategy, private equity, venture capital, and mergers and acquisitions. It provides the insights necessary to make informed decisions about where to compete and where to steer clear, enabling companies to gain a deeper understanding of the competitive landscape.
Get in Touch
We will respond to your message as soon as possible.
Insights to Win
Subscribe to our newsletter for in-depth analysis, reports, and our perspectives on business and economic issues related to the Japanese market and the global economy.