
Most Profitable Japanese Industries: Japan’s Profitability Medalists™ — Who’s Who? Report
In June 2026, SoftBank briefly surpassed Toyota to become Japan’s most valuable publicly listed corporation, owing to its investments in AI and related technologies. A few weeks later, Mitsubishi UFJ Group regained its position as Japan’s leading firm from Toyota.
During the same period, Samsung and HK Hynix garnered international attention for their remarkable quarterly profits and increases in market capitalization, including reports of substantial employee bonuses—ranging from $400,000 to $574,000. This development prompts an inquiry: what is the current performance of Japanese firms and industries amid Japan’s stock market surge and the profitability boom driven by artificial intelligence and the depreciation of the Japanese yen?
The flaw in the commonly accepted perspective on “the most profitable industries” is its static view of profitability as measured by total profit share, without considering whether these industries’ shares increase or decrease over time or their quarterly contributions to overall national profit growth.
While an industry’s profit share is an important metric, it is essential to acknowledge that industries are not uniformly distributed across nations. Some industries are smaller, older, or more established, whereas others are medium-sized, large, or emerging as new sectors.
Consequently, our methodology, while acknowledging the importance of industry size in relation to its share of total profit, primarily focuses on the growth rate of each industry’s profit share to facilitate a more equitable comparison. This comparison is conducted by benchmarking each quarter (or period) against the corresponding quarter.
The Growth Rate Thresholds That Must be Exceeded to be Designated a Profitability Medalist
Two thresholds apply: the minimum growth rate (15%), representing the average ordinary profit growth rate across all industries except finance and insurance, and the definitive threshold (the national benchmark), which applies to all industries (22%).
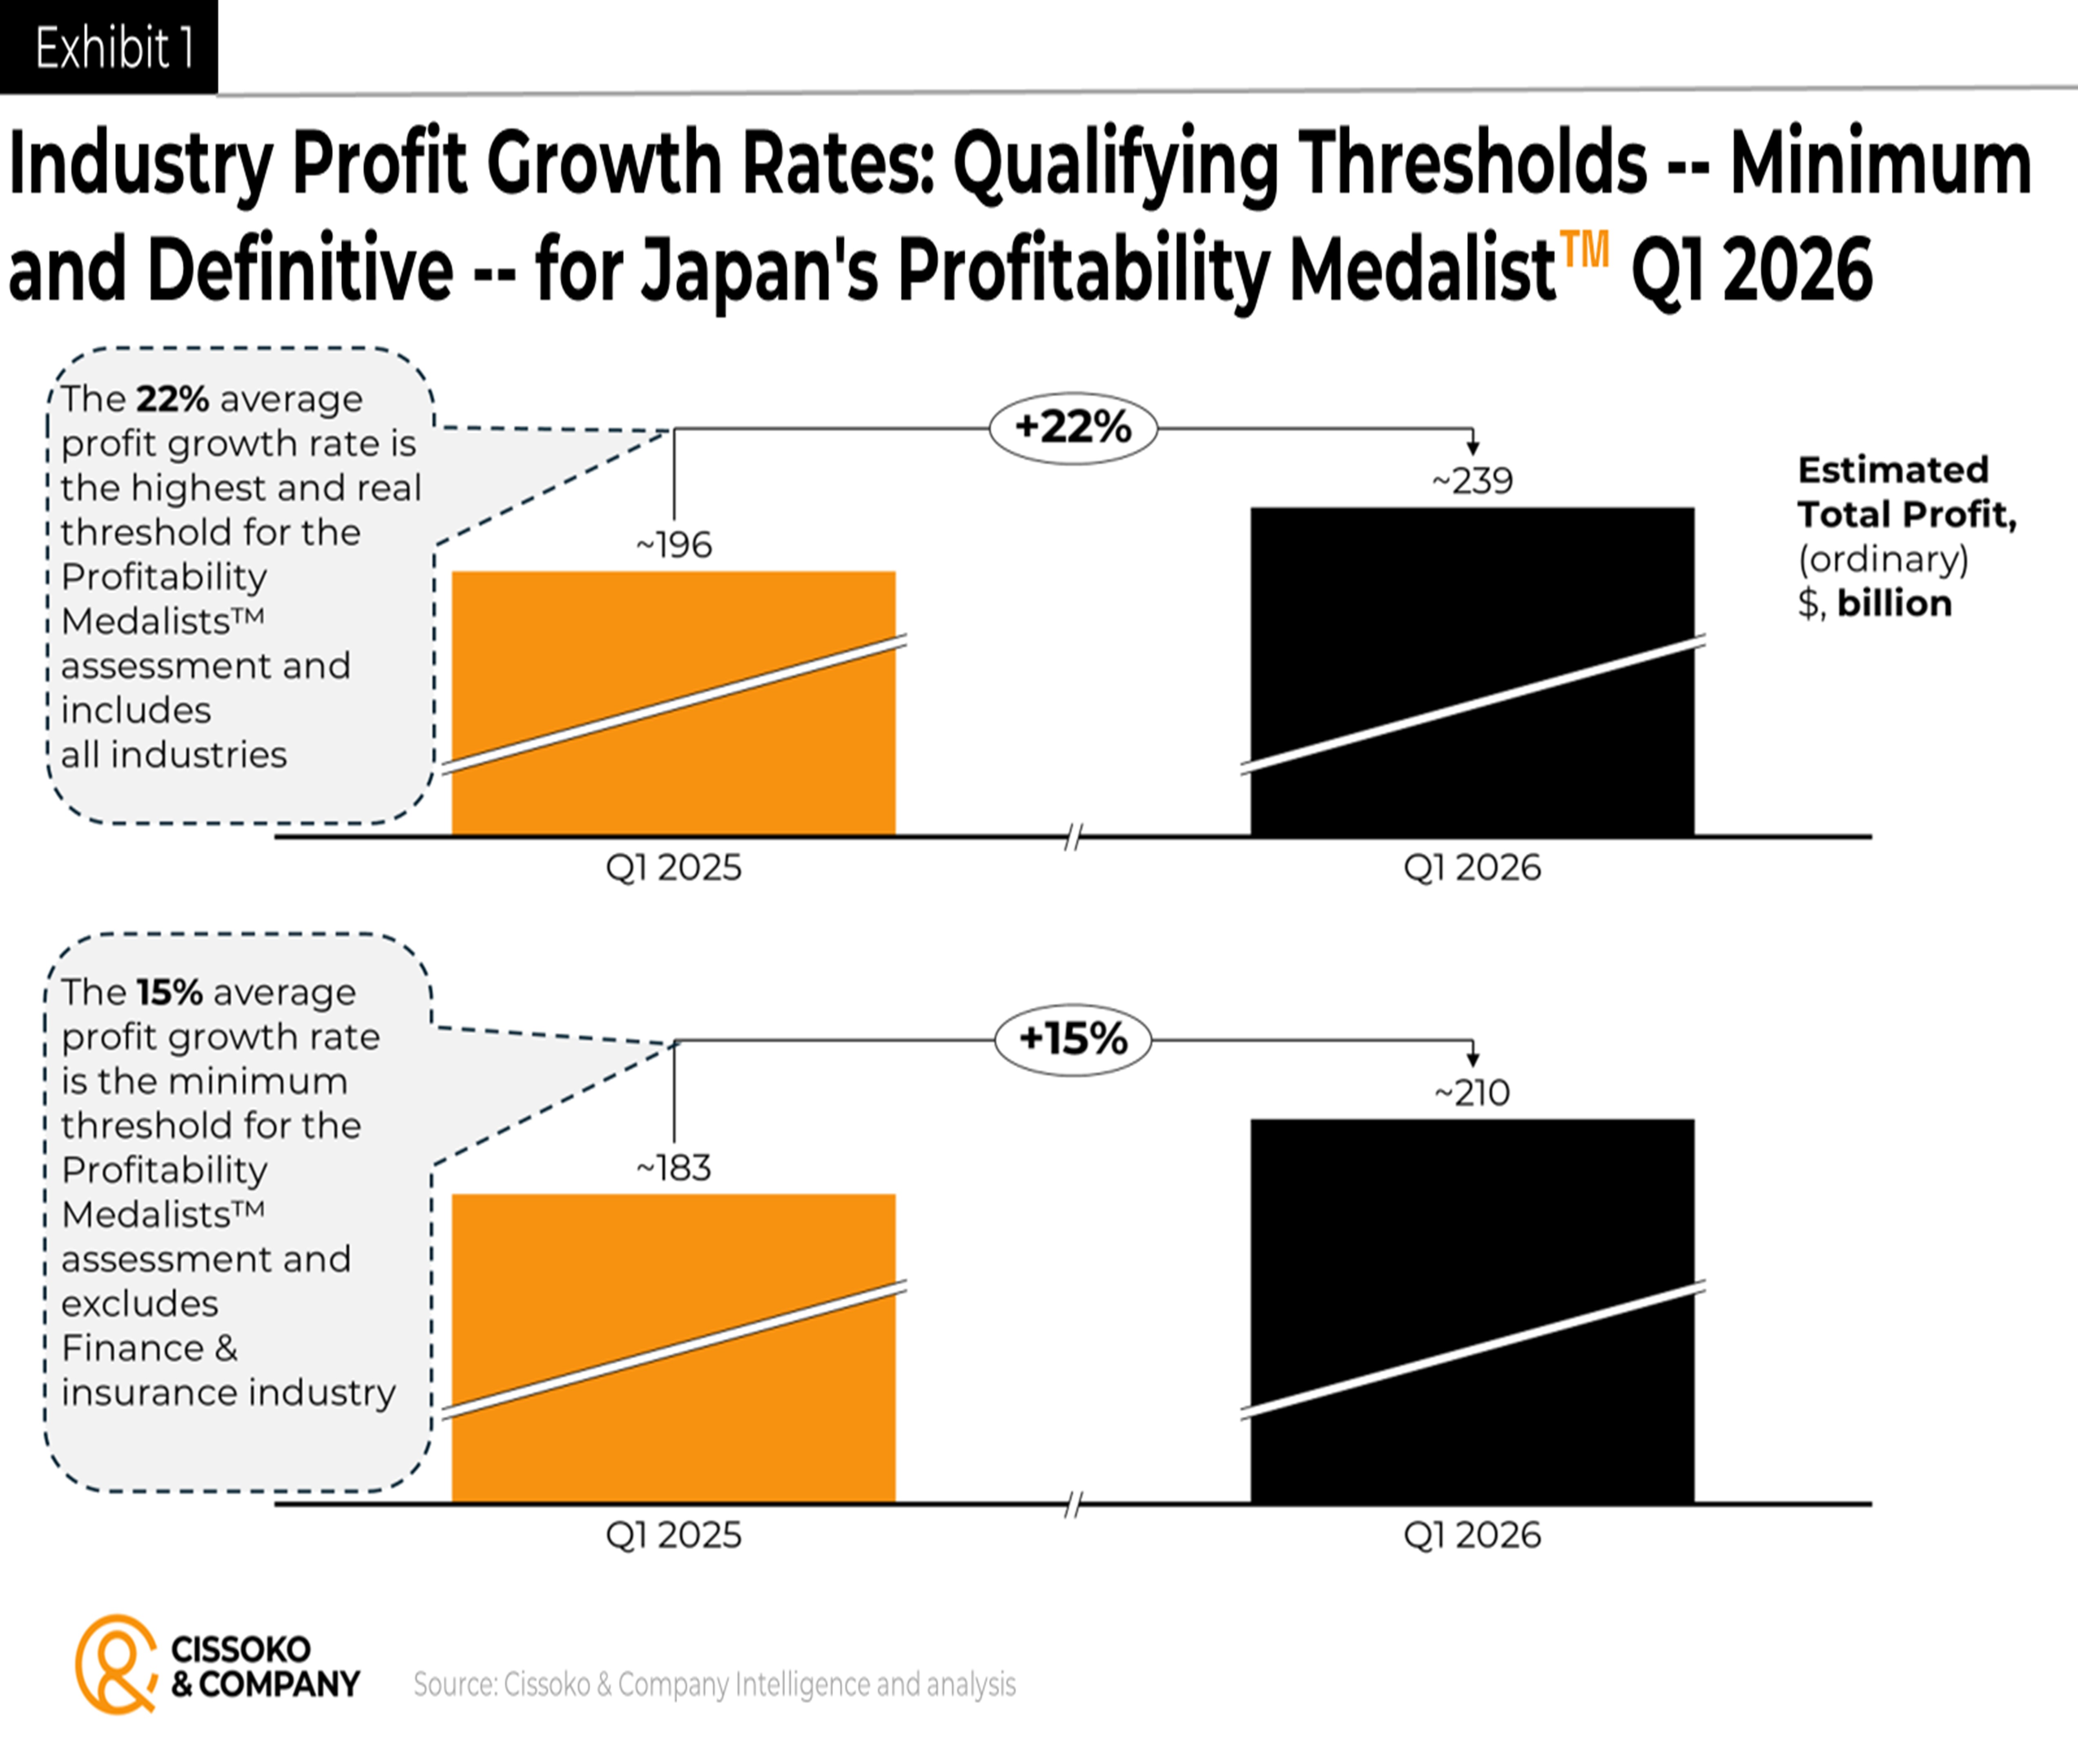
Thus, any industry with a profit growth rate below these identified thresholds, while it may be profitable, is not considered in our methodology as a Japan’s Profitability Medalist™
Most Profitable Industries Q1 2026: Japan’s Profitability Medalists™
Indeed, in our classification of firms by performance, we believe there is a significant difference between a profitable firm (or industry) and a Profitability Medalist™. For one thing, profitable firms (or industries) are those that are making a profit by crossing the break-even line by any amount through higher profit margins, sales volumes, or a combination of both. These transactions among firms across an industry lead to the industry’s total profit (operating or ordinary profits).
However, Japan’s Profitability Medalist™ refers to the quarterly or annual total profit growth rates across industries compared with the national average profit growth. We try to answer the question: Which Japanese industries have total profit growth rates higher than the average in a given quarter or year? Among these industries, which ones truly outperform the average profit growth and other industries by a wider margin?
To do so, we first determine the average profit growth rate nationwide, then rank industries by how much their quarterly or annual profit growth rates exceed that average. For an apples-to-apples comparison, we compare each quarter to the same quarter of the previous year. In annual rankings, we compare each industry’s total profit growth rate against the average yearly industry profit growth rate.
The Top Three Industries Identified as Japan’s Profitability Medalists™
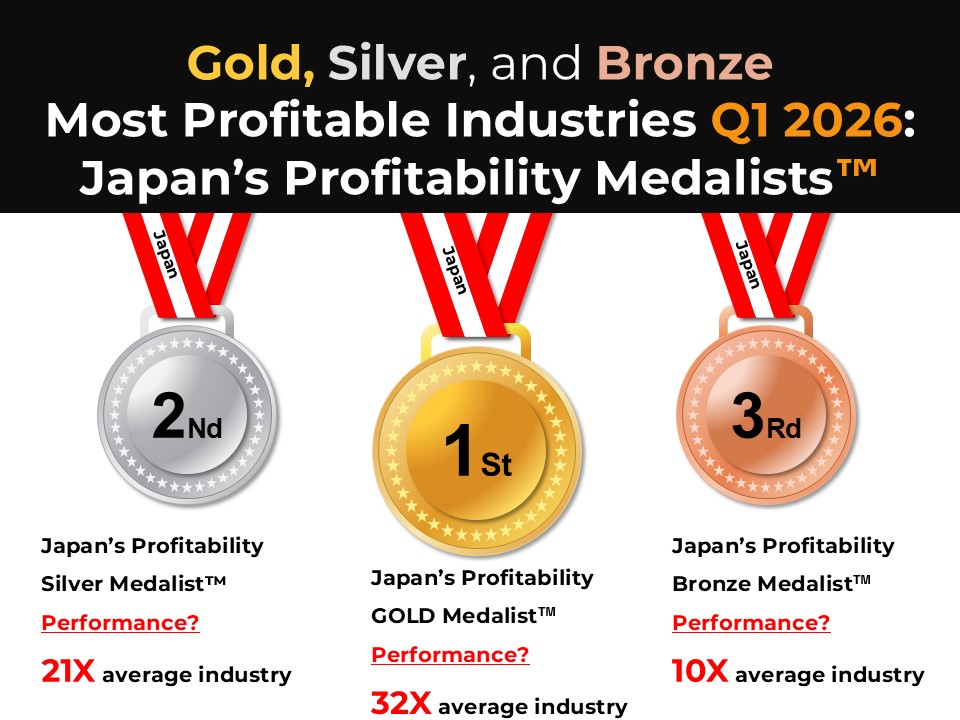
Among the profitability medalists™ in the first quarter of 2026, three industries stood out for their extraordinary total profit growth rates compared with the same period last year.
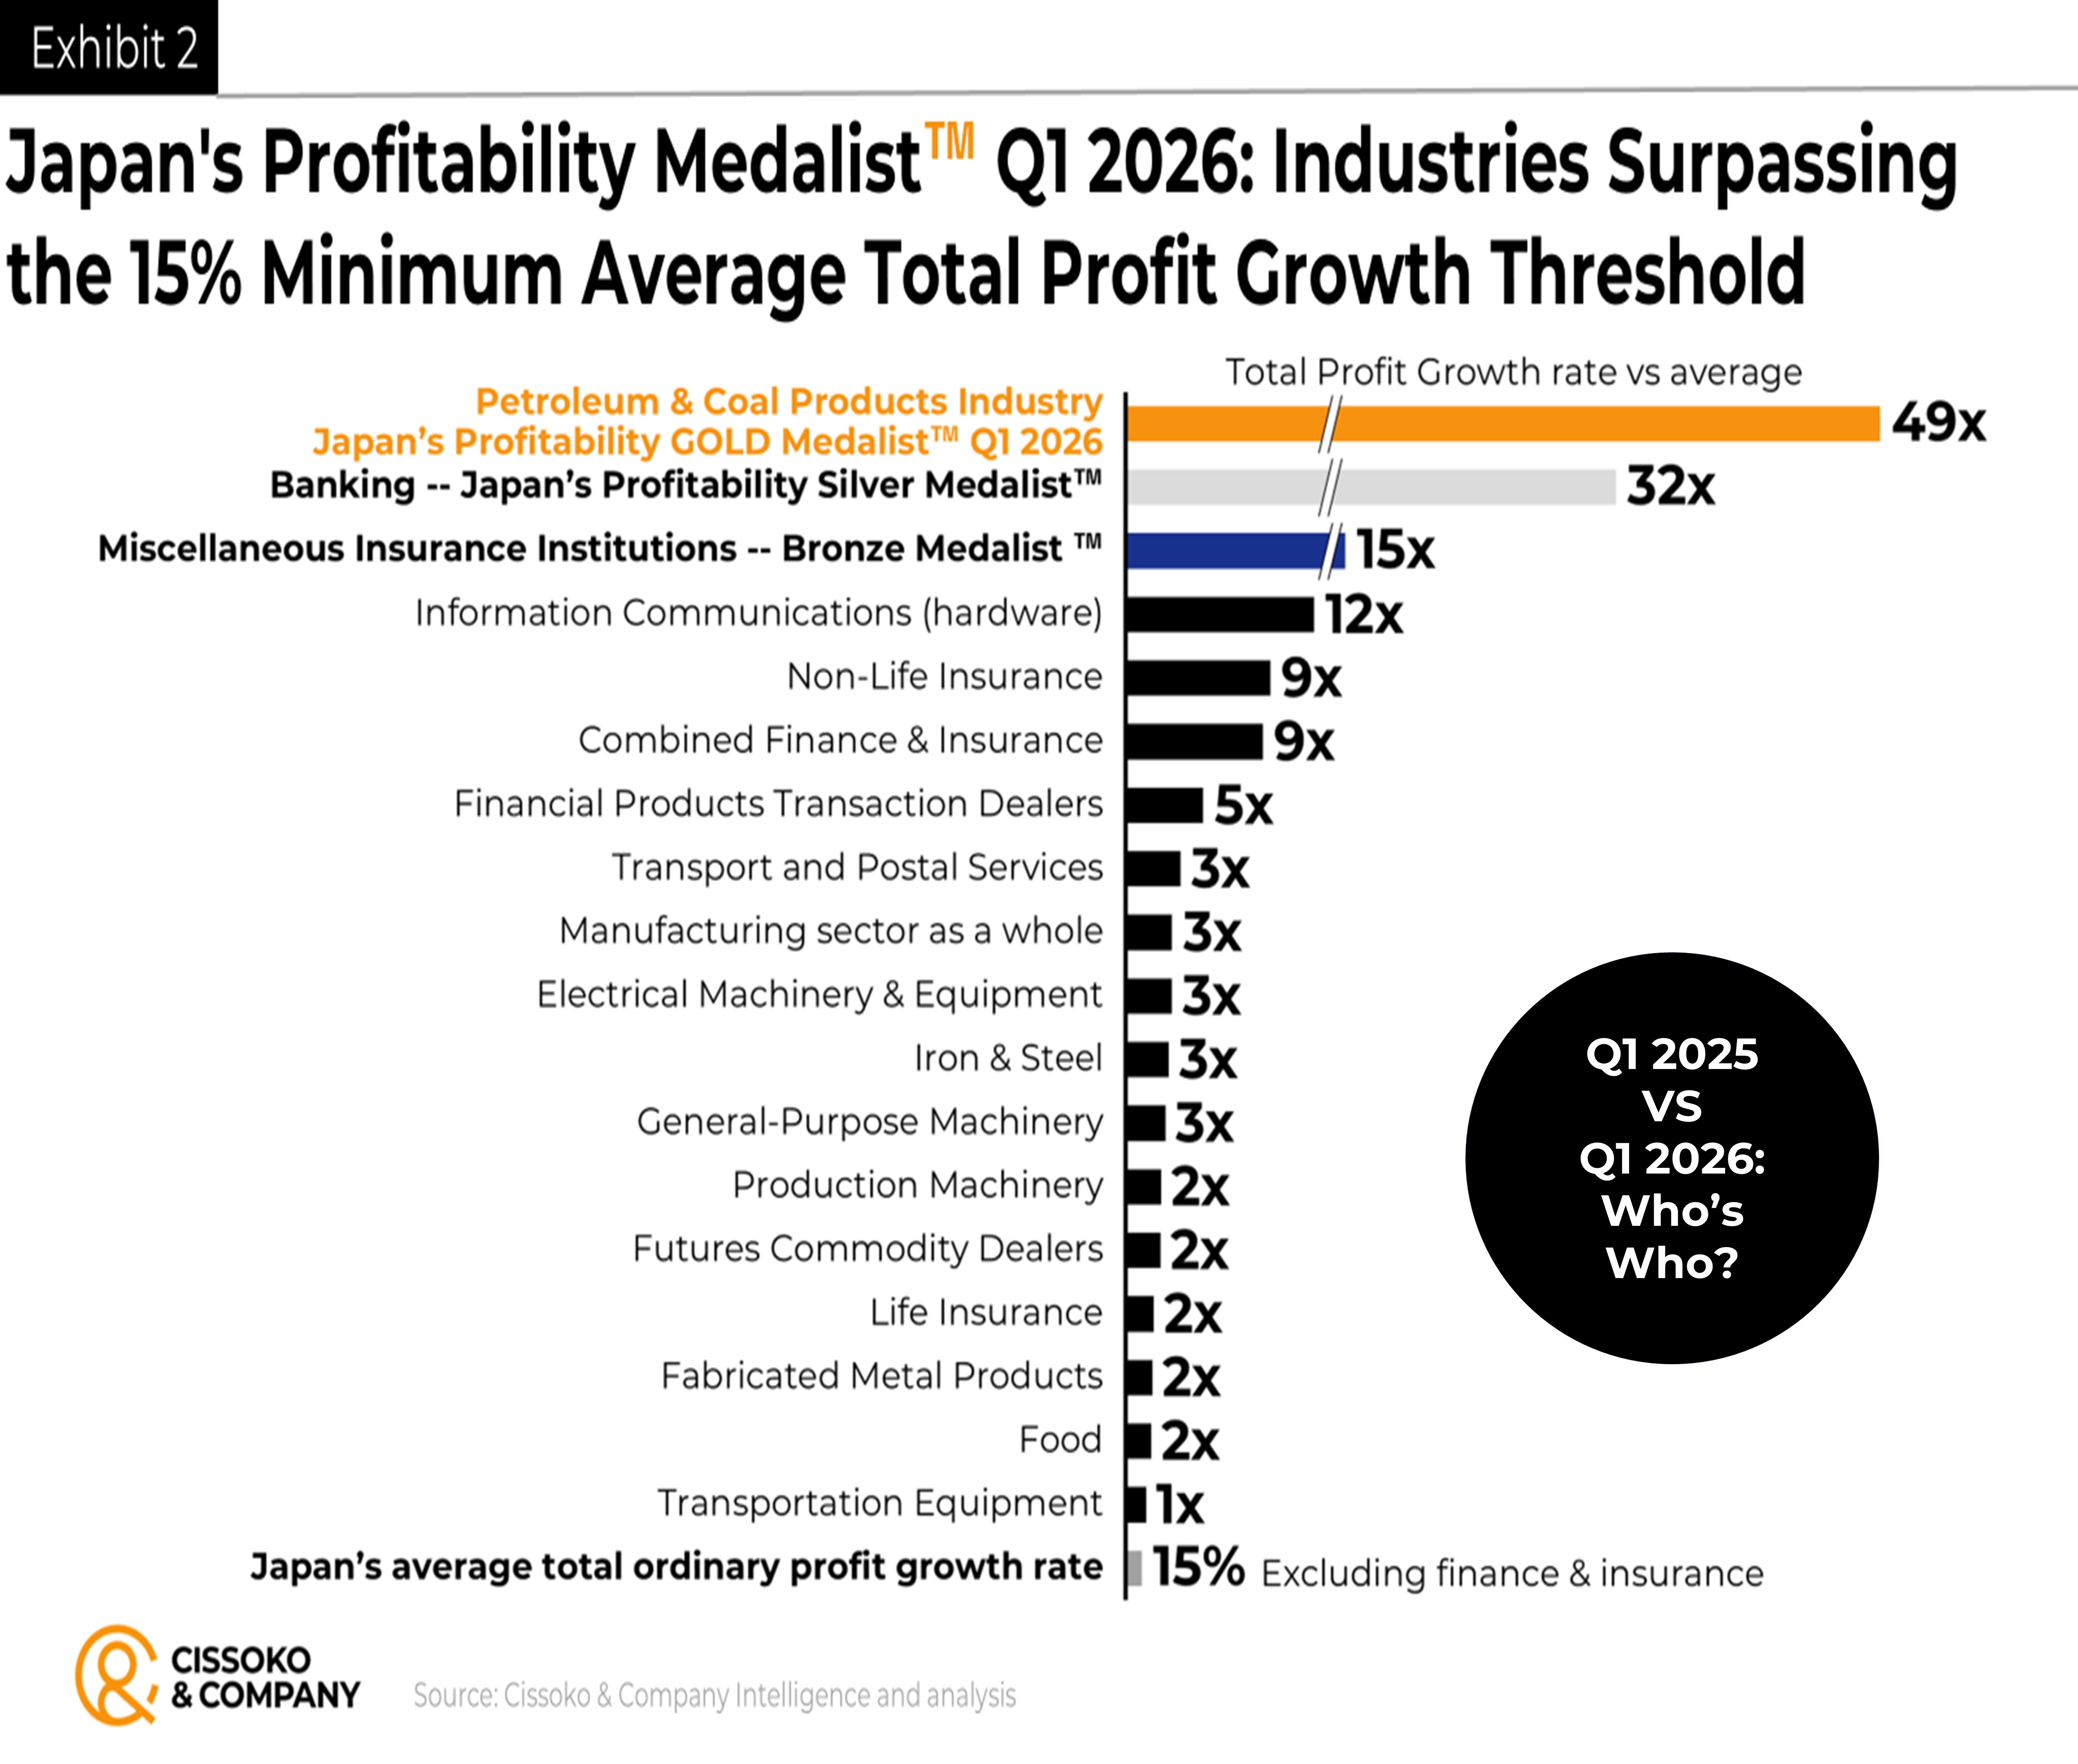
First is Japan’s Profitability GOLD Medalist™: the petroleum and coal industry. Compared with the average Japanese industry using the minimum threshold (15%), its profitability growth was about 49 times that of the average.
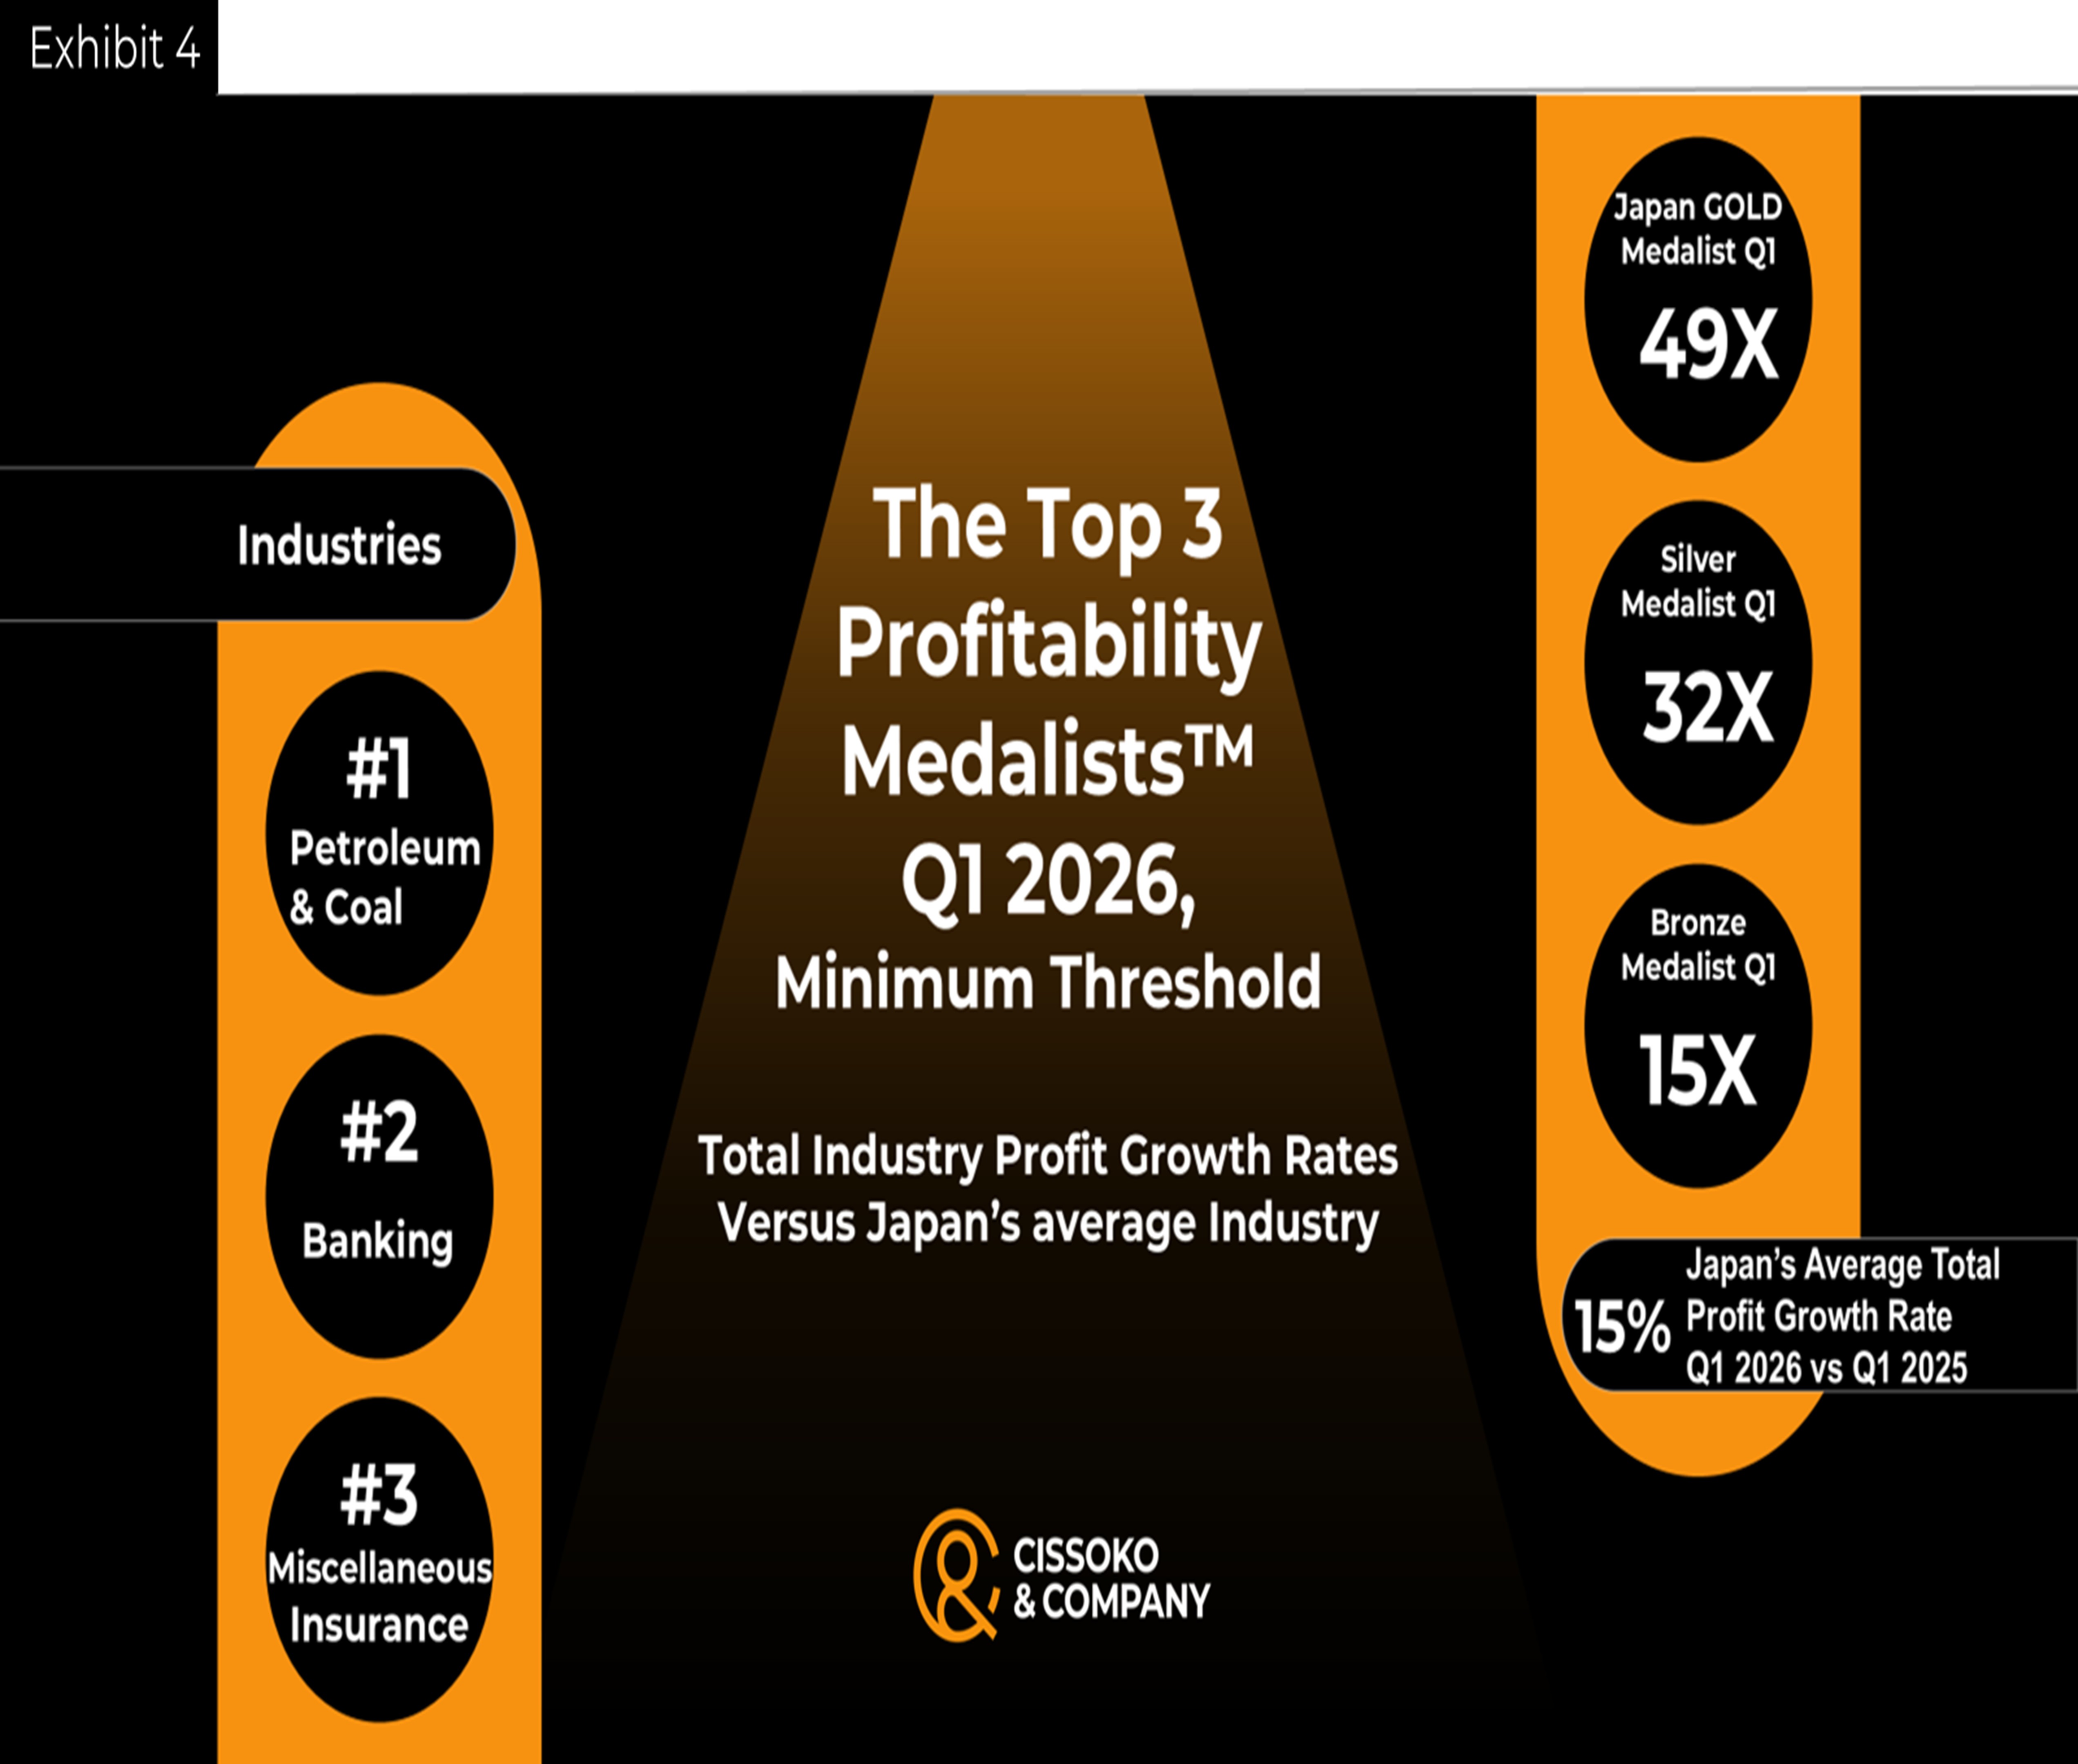
Japan’s banking industry closely followed as the Profitability Silver Medalist™. Using the same yardstick as above, Japan’s banking industry profit grew 32 times as much as the average industry.
Similarly, Japan’s Profitability Bronze Medalist™—the miscellaneous insurance institutions—outperformed the average industry by nearly 15 times.
Indeed, the other Profitability Medalists did very well, as most of them, except the transportation equipment industry, grew their total profit at least twice as much as Japan’s average industry in the first quarter of 2026, when measured against the minimum qualifying threshold to be designated as Japan’s Profitability Medalist™ Q1 2026. That is, an average (ordinary) profit growth rate of 15%.
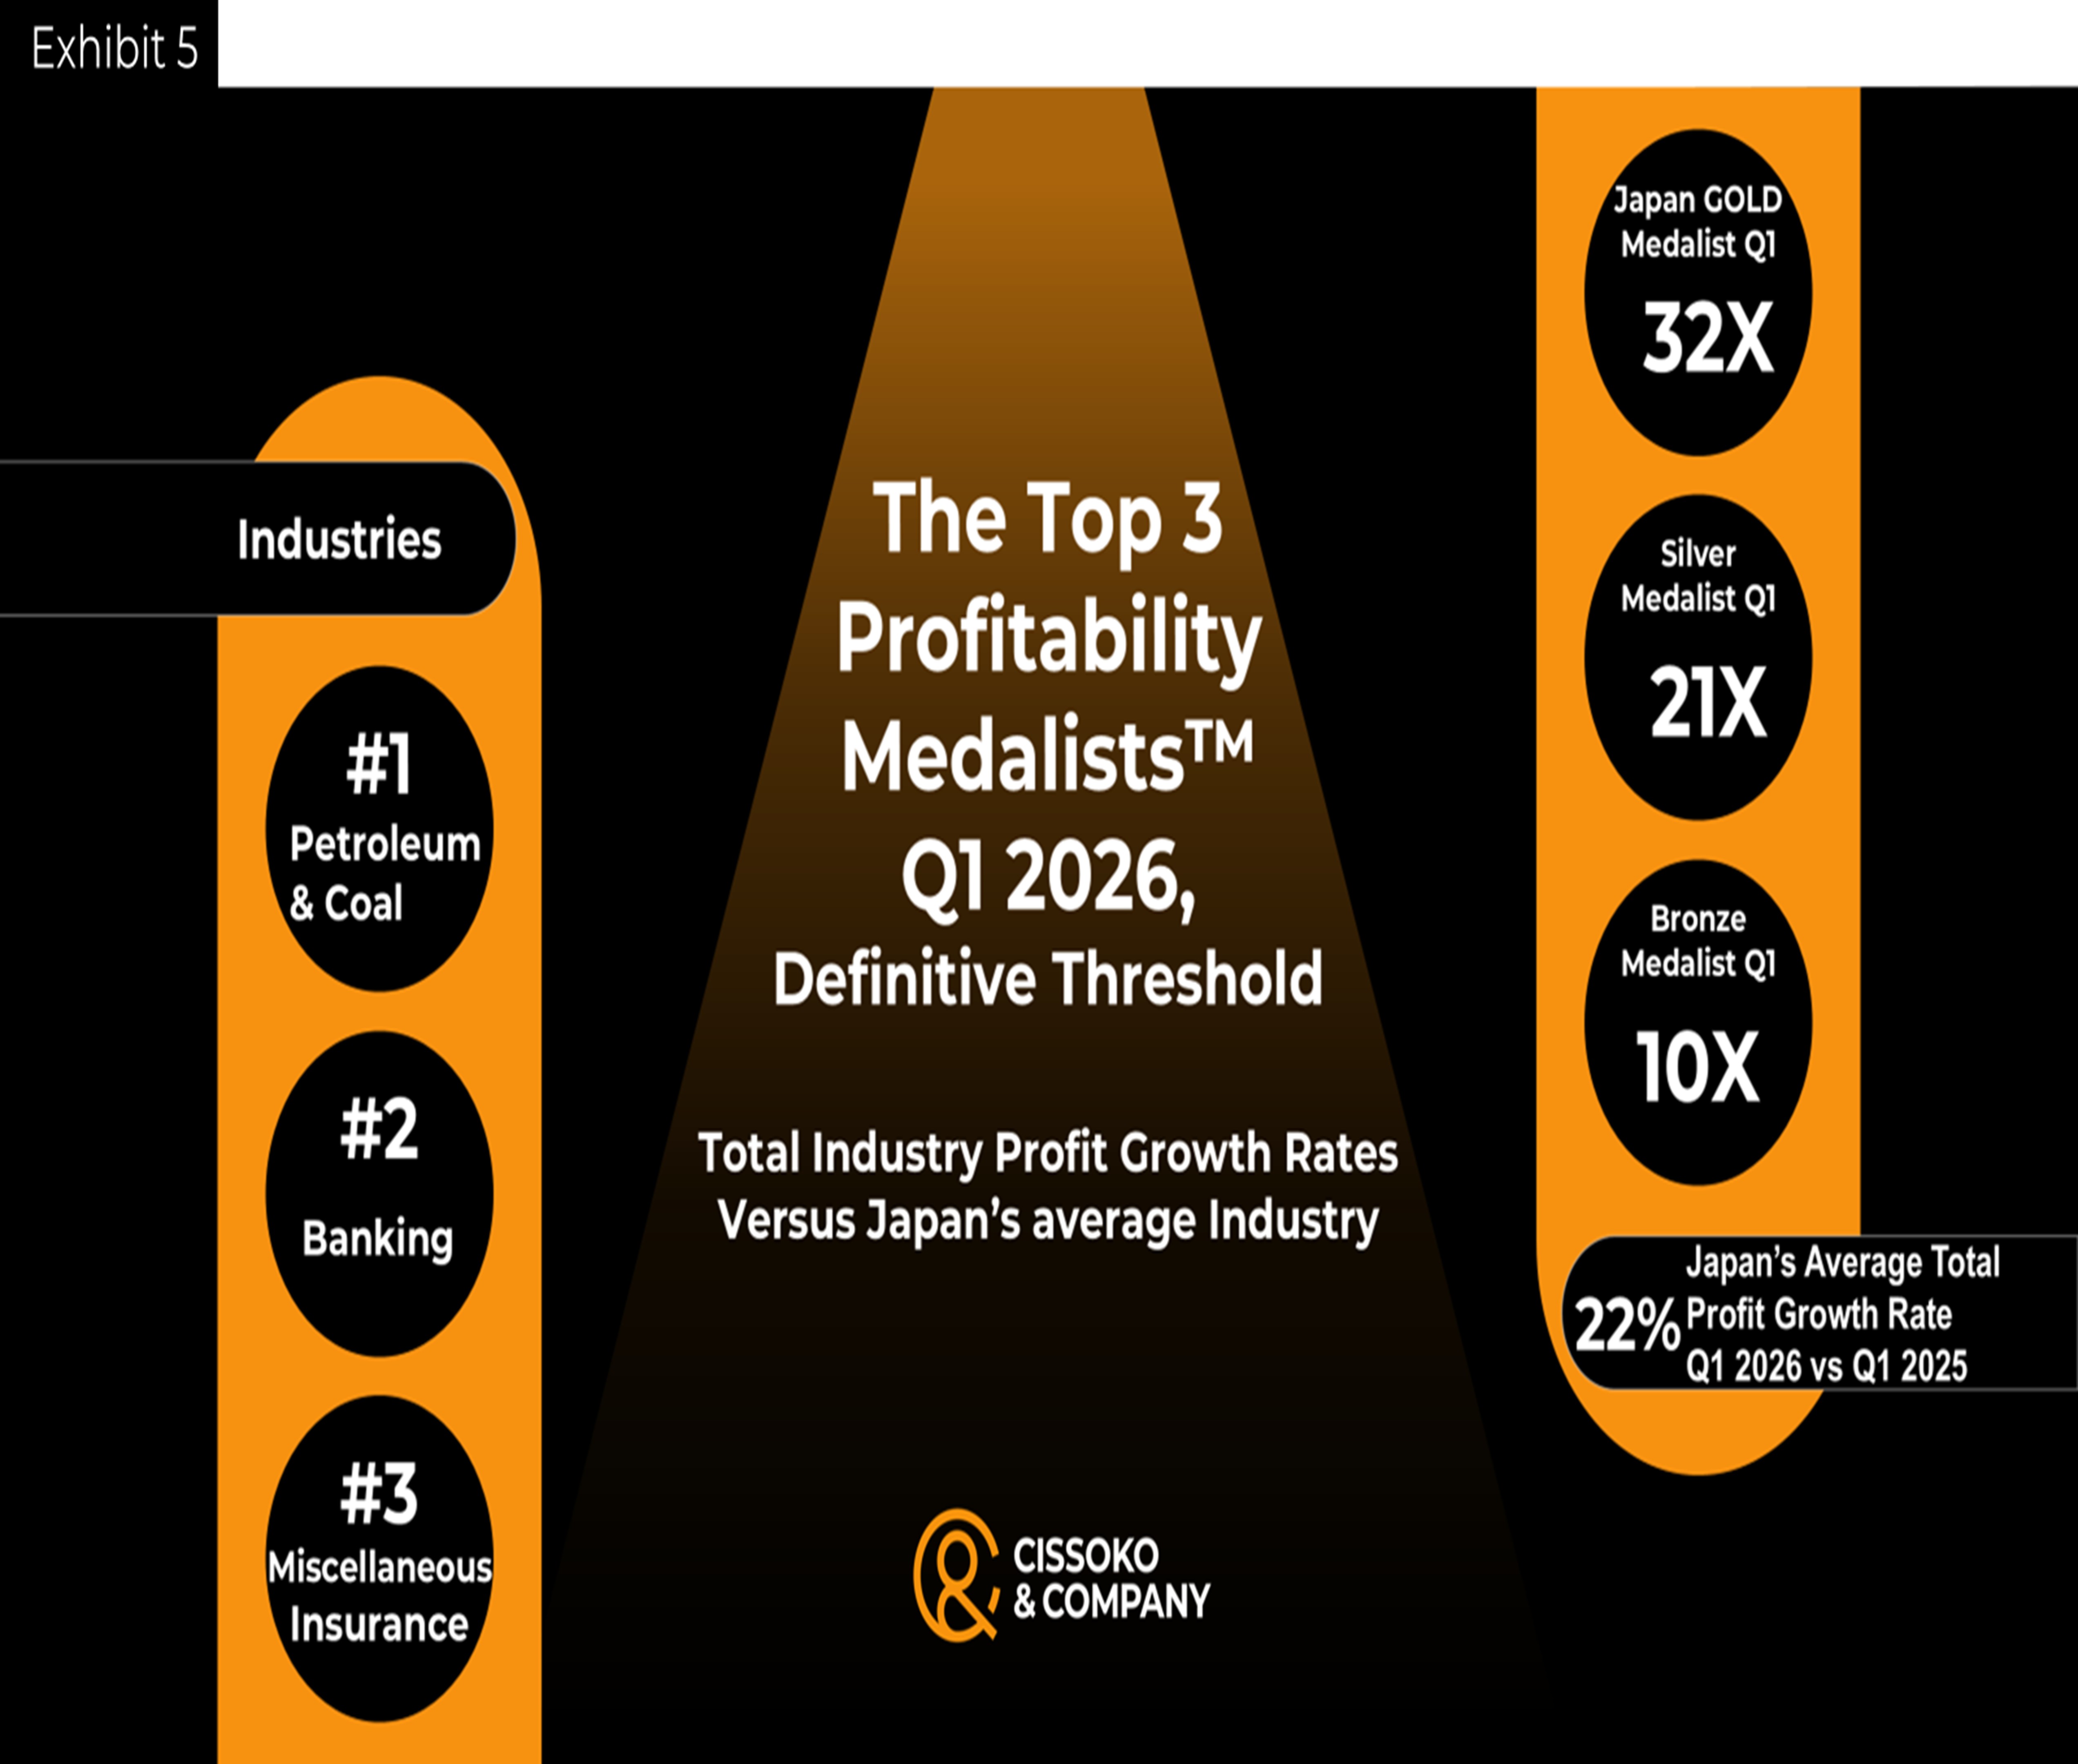
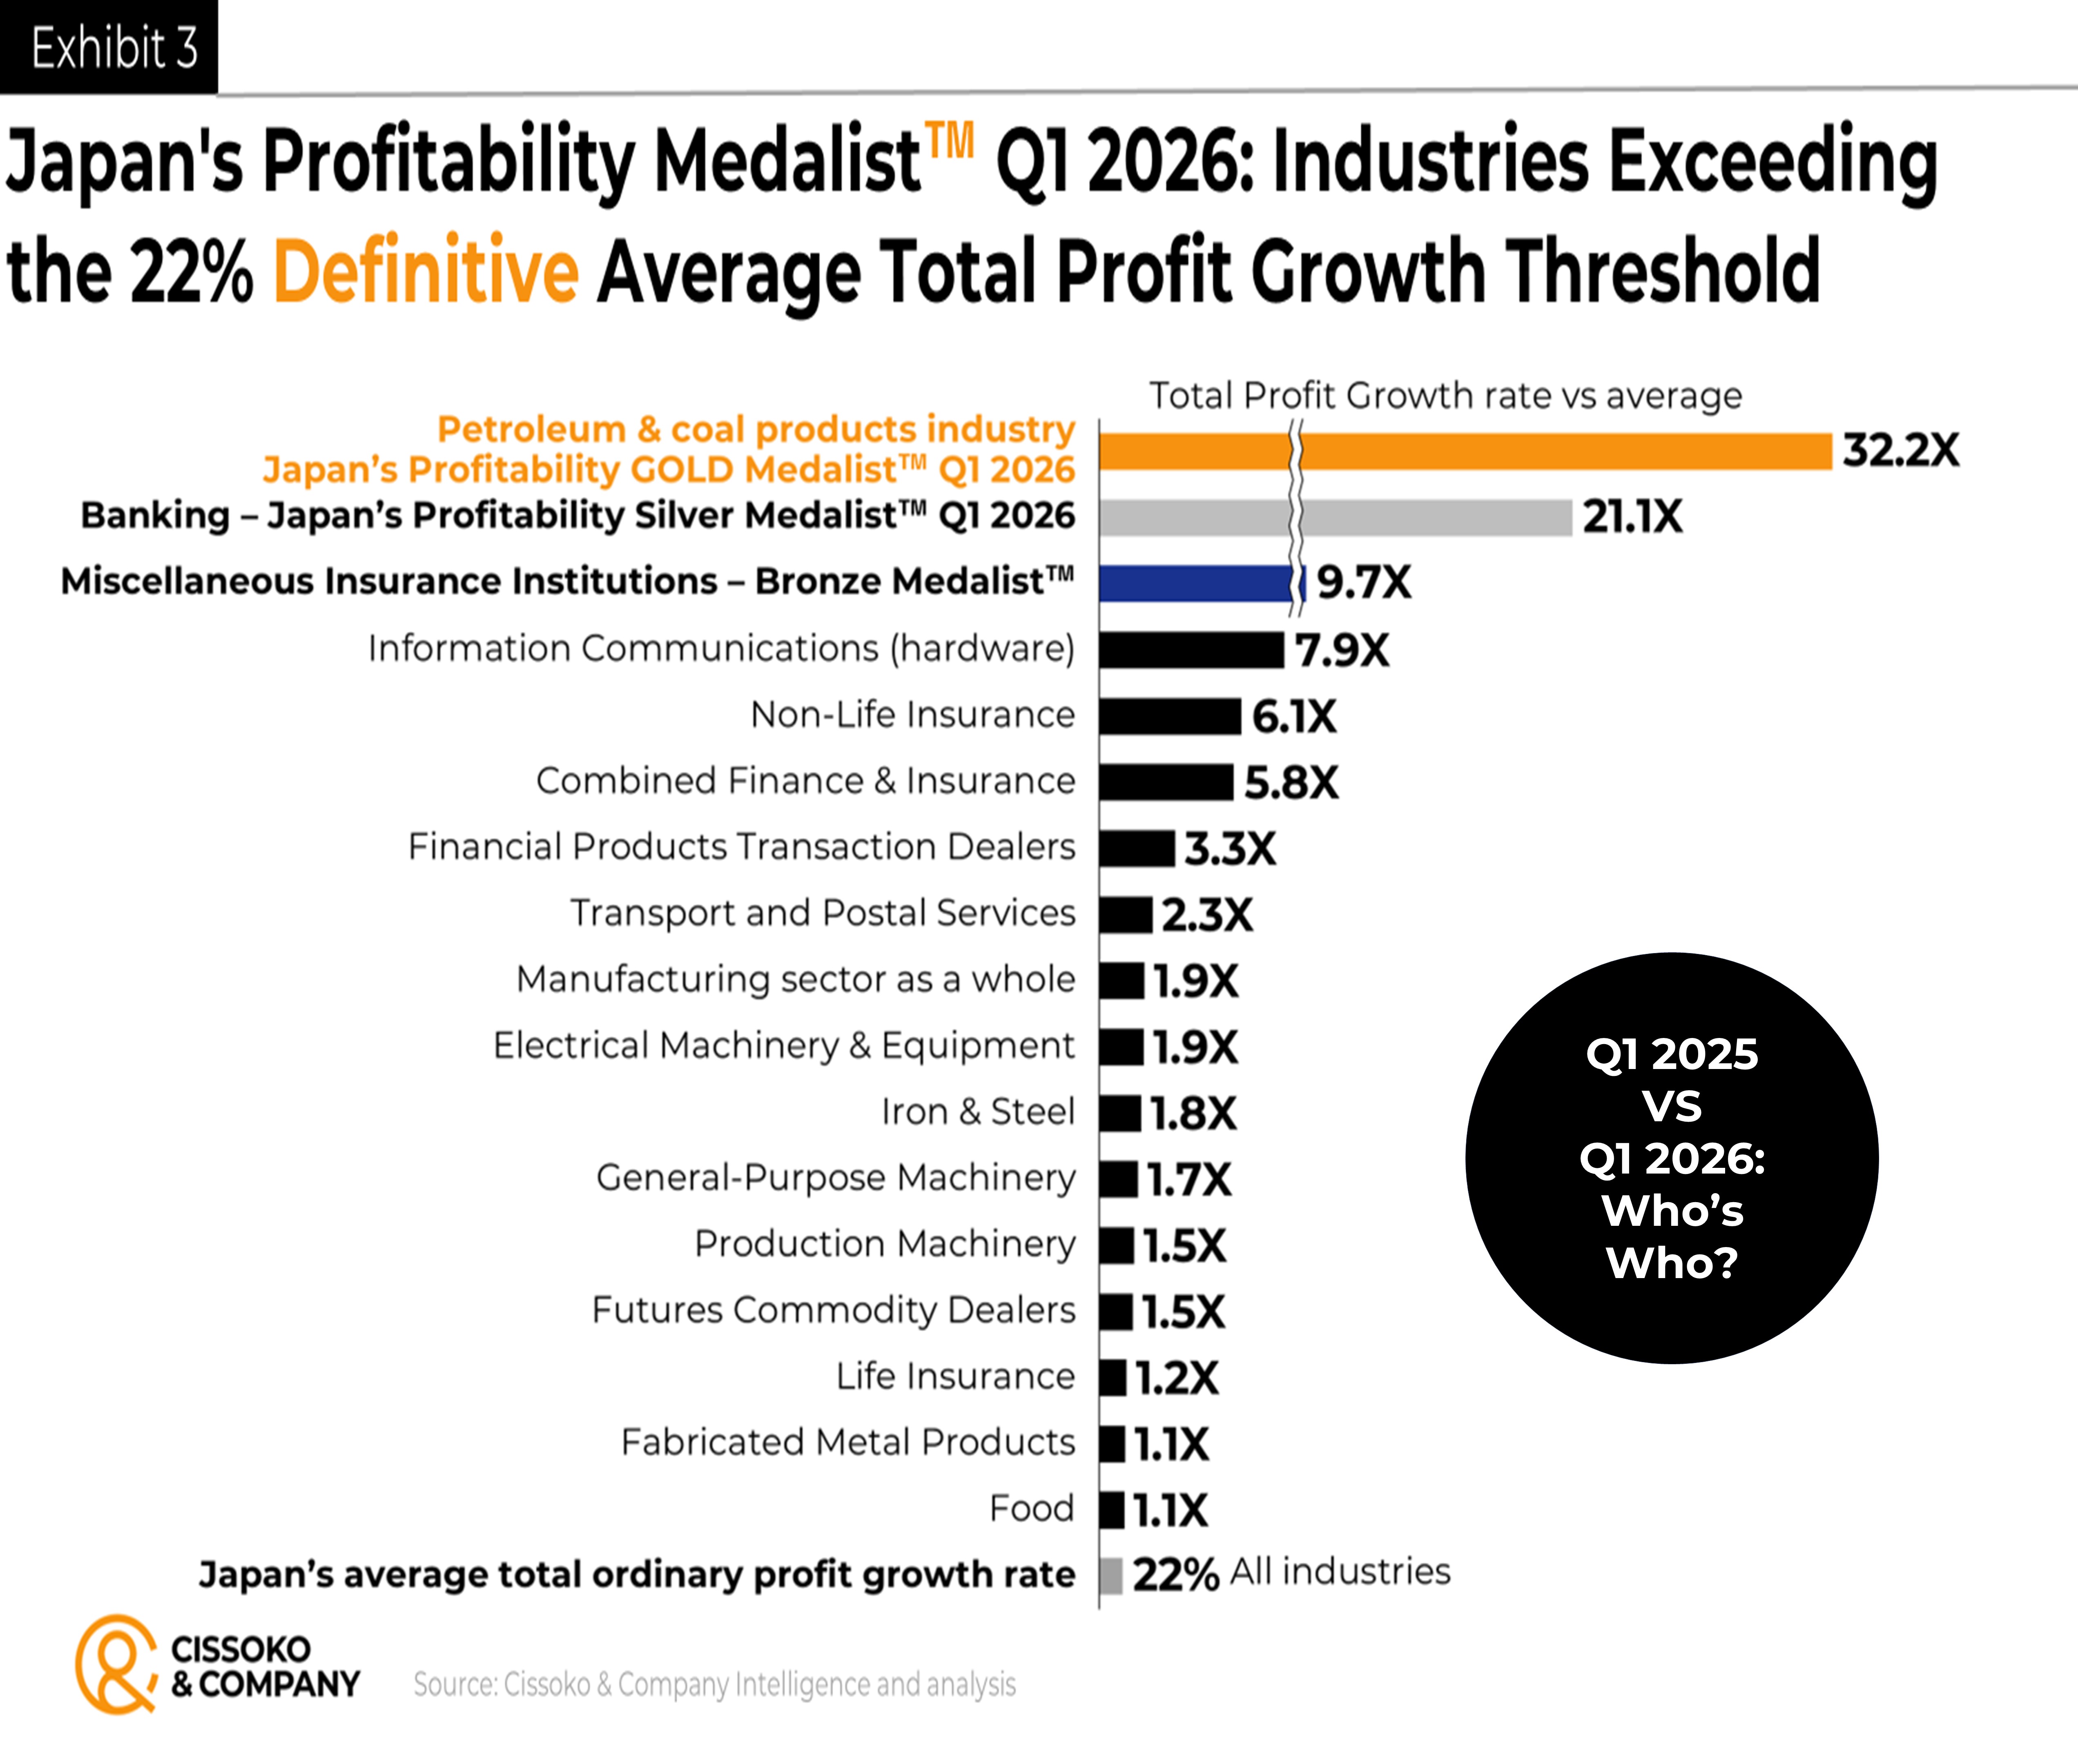
However, only eight industries—transport and postal services, financial products transaction dealers, combined finance and insurance industry, non-life insurance, information and communications (IT hardware), miscellaneous insurance institutions, banking, and the petroleum and coal industry—exhibited total profit growth rates that were twice the definitive (qualifying) average industry profit growth threshold of 22%.
Distribution of Japan’s Profitability Medalists™ Q1 2026 by Sector
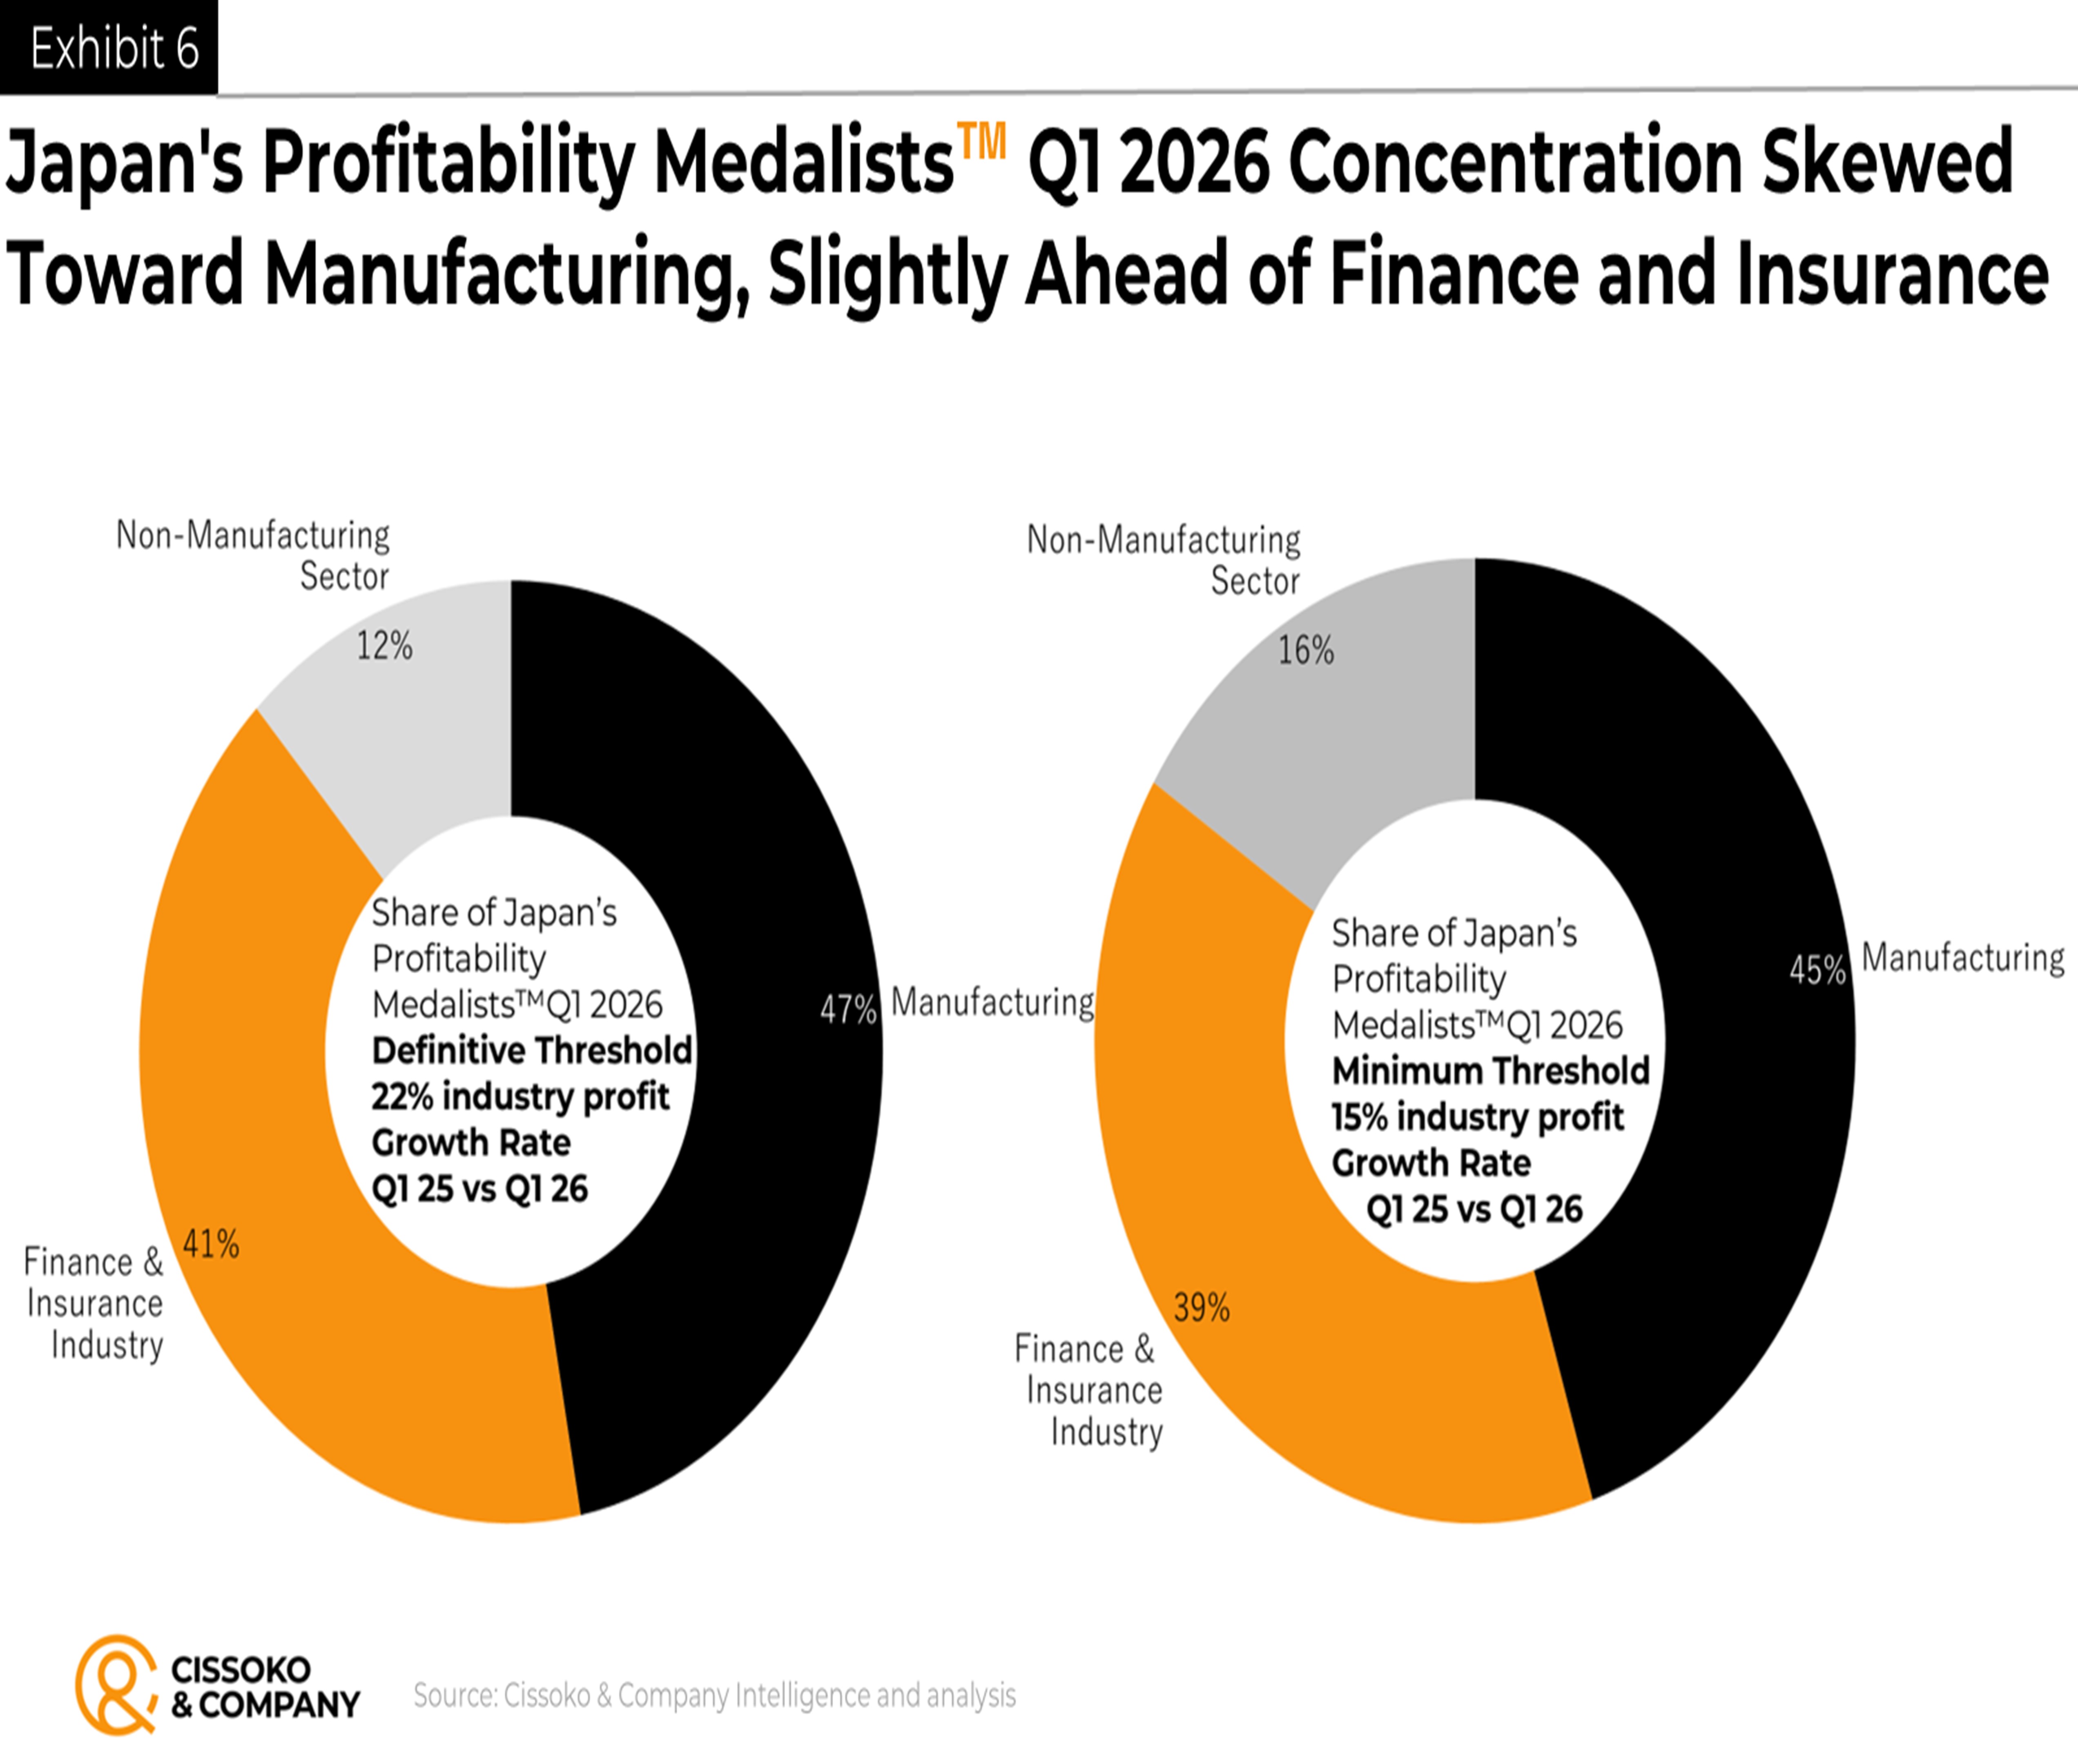
Our analysis indicates that the manufacturing sector was predominant, exhibiting a marginal advantage over the finance and insurance industry. Conversely, the non-manufacturing sector, excluding finance and insurance, struggled, accounting for less than 17% of Japan’s Profitability Medalists™ in the first quarter of 2026, compared to the same period in the previous year.
One of the most detrimental tendencies in management and leadership is complacency based on past achievements. Japan’s Profitability Medalists™ in the early months of 2026 must endeavor diligently to sustain their esteemed titles by effectively managing risks and fostering resilience amid disruptions caused by supply chain issues and artificial intelligence across the global economy, extending beyond Japan’s borders.
This report is not an endorsement of any industry, and we did not write it as a guide for any financial or security transactions regarding the industries we identified as the winners in terms of profitability in the first quarter of 2026. Therefore, it should be understood as such.
Get in Touch
We will respond to your message as soon as possible.
Insights to Win
Subscribe to our newsletter for in-depth analysis, reports, and our perspectives on business and economic issues related to the Japanese market and the global economy.