
Japan’s GDP and Wealth: Key Trends Reshaping the Japanese Economy in the age of AI — Economic REPORT
Japan’s economy and national wealth are rapidly evolving in the age of artificial intelligence. While the economy has remained resilient in recent years, the global economic environment has shifted dramatically. Thanks to Russia’s invasion of Ukraine and Israel’s and the US’s failed attempt to topple the Iranian regime, which has resulted in the blockage of the Strait of Hormuz while disrupting the global energy market, with oil and gas prices going through the roof across countries around the globe.
Indeed, the Iran war has been a watershed moment for Middle Eastern countries still struggling to find ways to export their economy-dependent resources while maintaining investors’ confidence in the region’s stability for investment and tourism. This report focuses on the major trends reshaping the economic landscape of the Land of the Rising Sun over the decade leading up to the end of fiscal year 2024. That is, approximately 15 years.
The Sectoral Composition of Japan’s Nominal GDP Over the Past Decade
A bird’s-eye view of the distribution of Japan’s nominal GDP across its primary, secondary, and tertiary industries over the past decade suggests that shares have remained flat across industries.
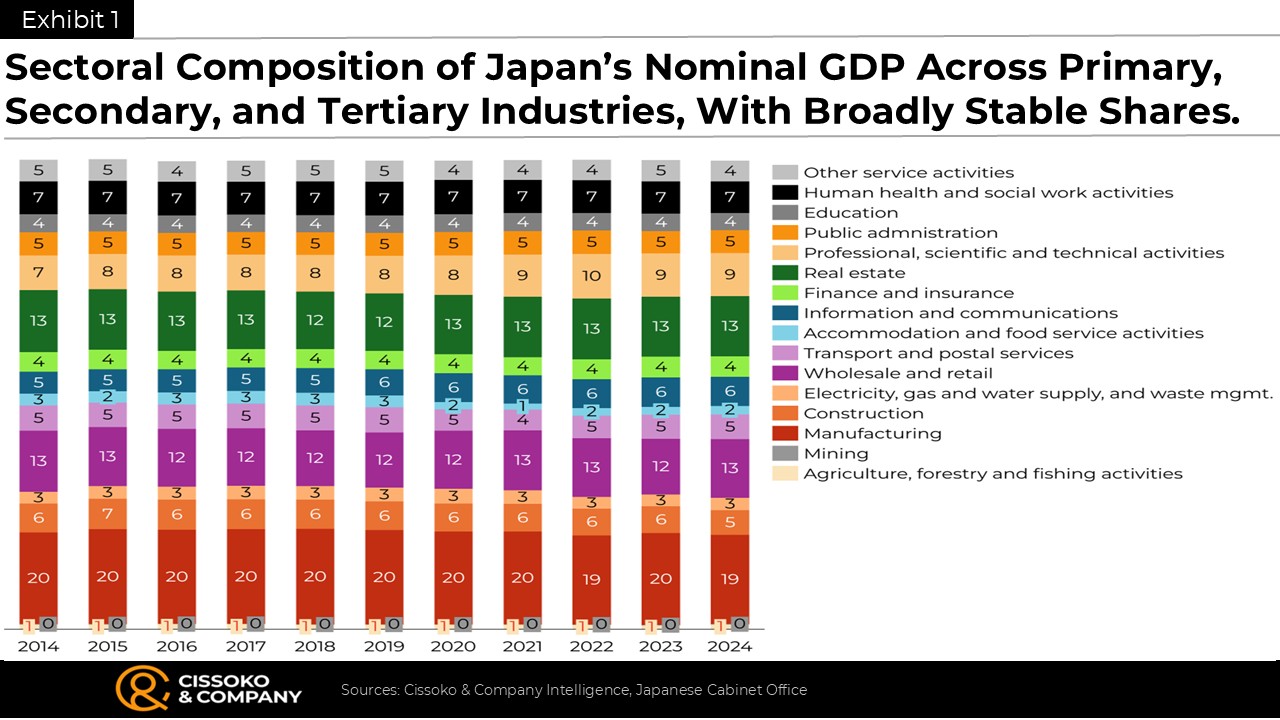
But the tertiary sector dominates economic activity, and the primary sector’s share has become so small that it is harder to discern on a chart.
Japan’s Nominal GDP Trends From 2010 to 2024
The country’s nominal GDP grew at a 1.7% CAGR from 2010 to 2024, reaching ¥642 trillion, indicating a solid recovery from COVID-19 and other external economic shocks in recent years.
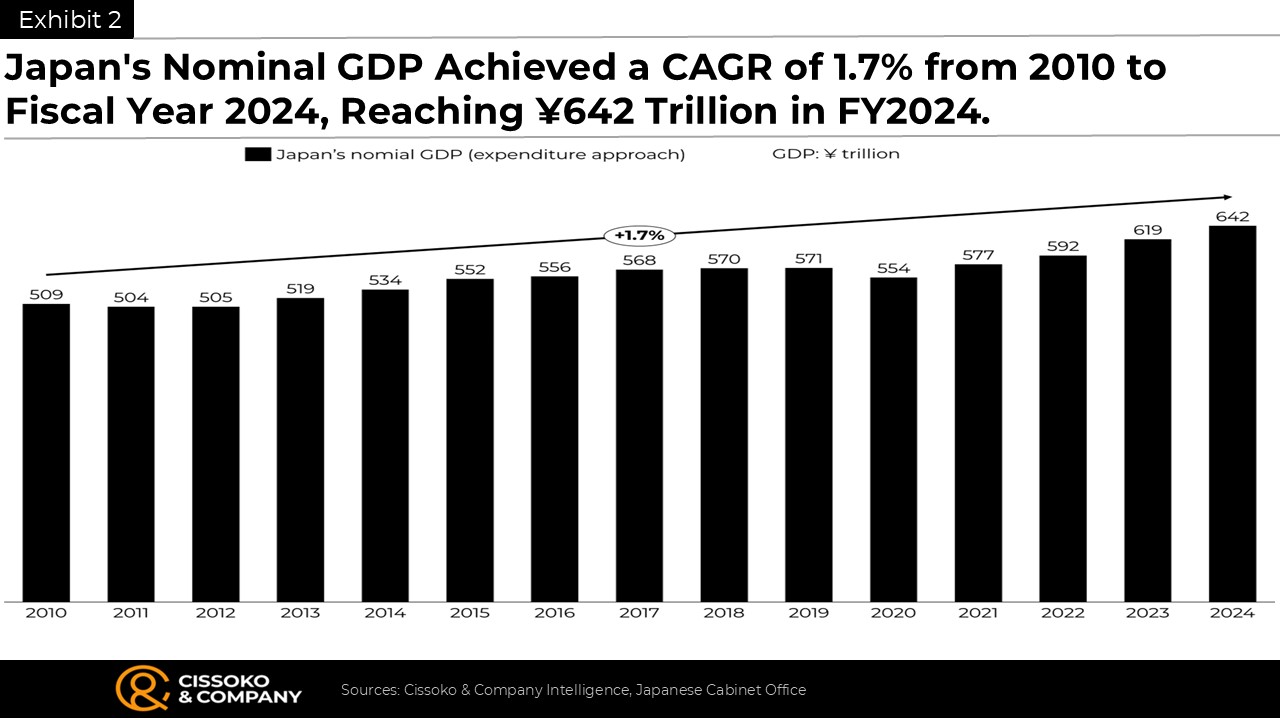
Indeed, corporate Japan has become more profitable than expected in the post-COVID-19 era, with aggregate corporate profit (ordinary) soaring more than 20%.
Share of Japan’s Nominal GDP by Economic Activities
Indeed, like the tertiary industry, market producers increasingly dominate Japan’s economic activities, accounting for nearly 70%, followed by the secondary industry, including mining and construction.
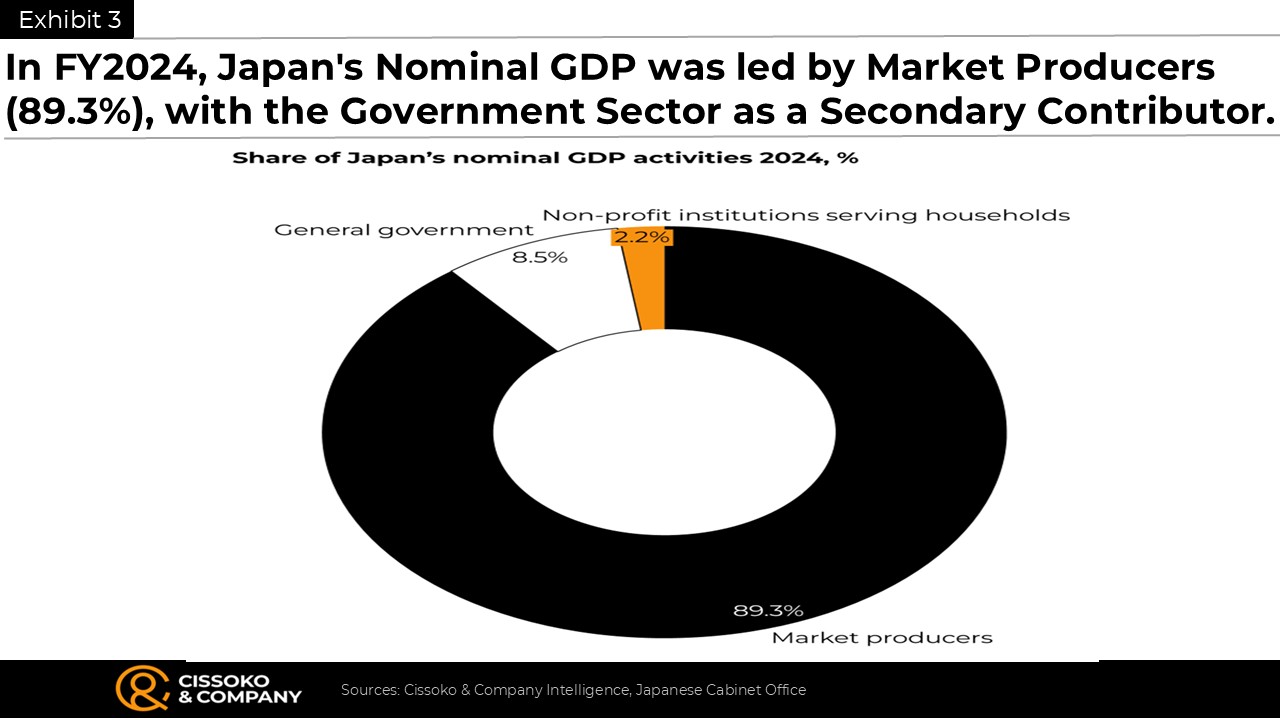
Far behind is the primary industry, which struggles with an acute shortage of farmers, most of whom are nearing retirement age, including the depopulation of rural areas. Most of the younger generation wants to live in major cities for career opportunities.
Japan’s GDP Trends Across the Primary Industries Over Recent Years
Across the Japanese economy, the primary industry, including fisheries, agriculture, and forestry, has struggled to increase its share of total economic activity in recent years.
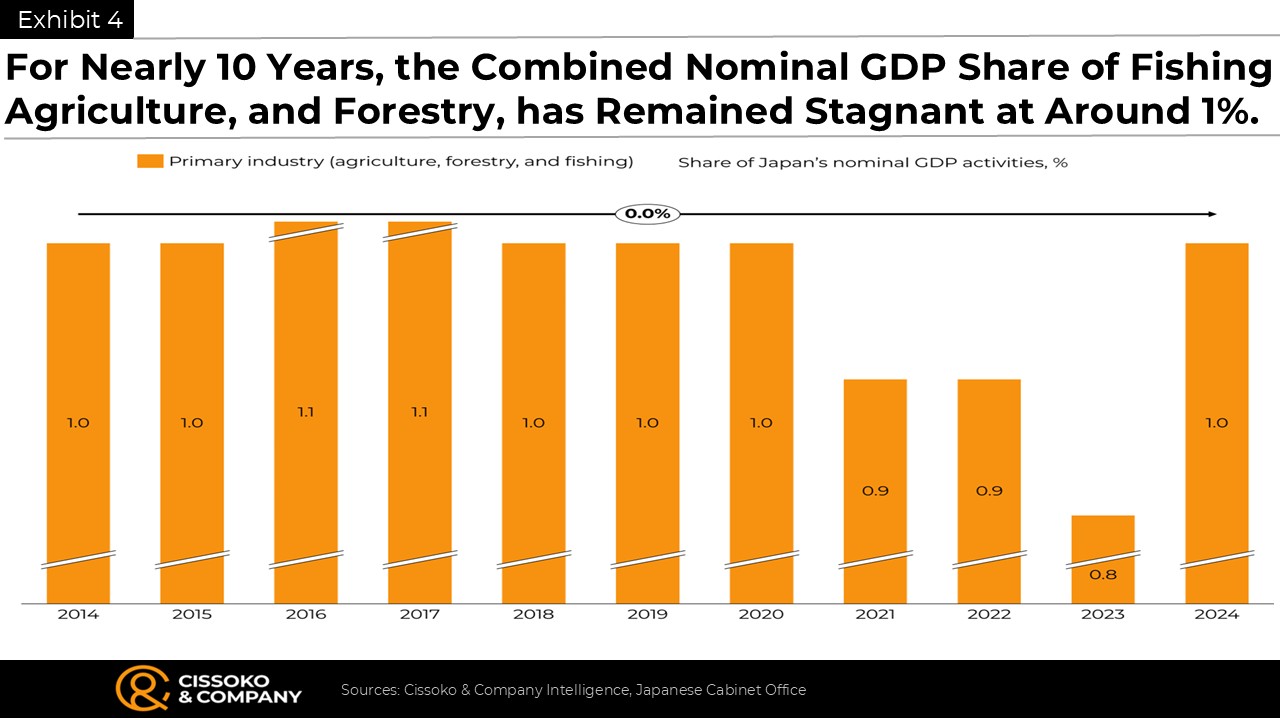
In fact, the sector as a whole has human capital problems. Consider this: in 1990, Japan had 4.81 million registered farmers. By 2020, the number had declined by 71% to 1.4 million. Similarly, in 1990, 33% of Japanese farmers were aged 65 and older. By 2020, the percentage had increased to 70%.
Japan’s GDP Trends Across the Secondary Industries
From nearly 26% in 2014, Japan’s secondary economic activity has shrunk at a compound annual rate of 0.6% through fiscal year 2024. The most powerful sector across the secondary industry is construction. Indeed, players in the construction industry have been struggling recently.
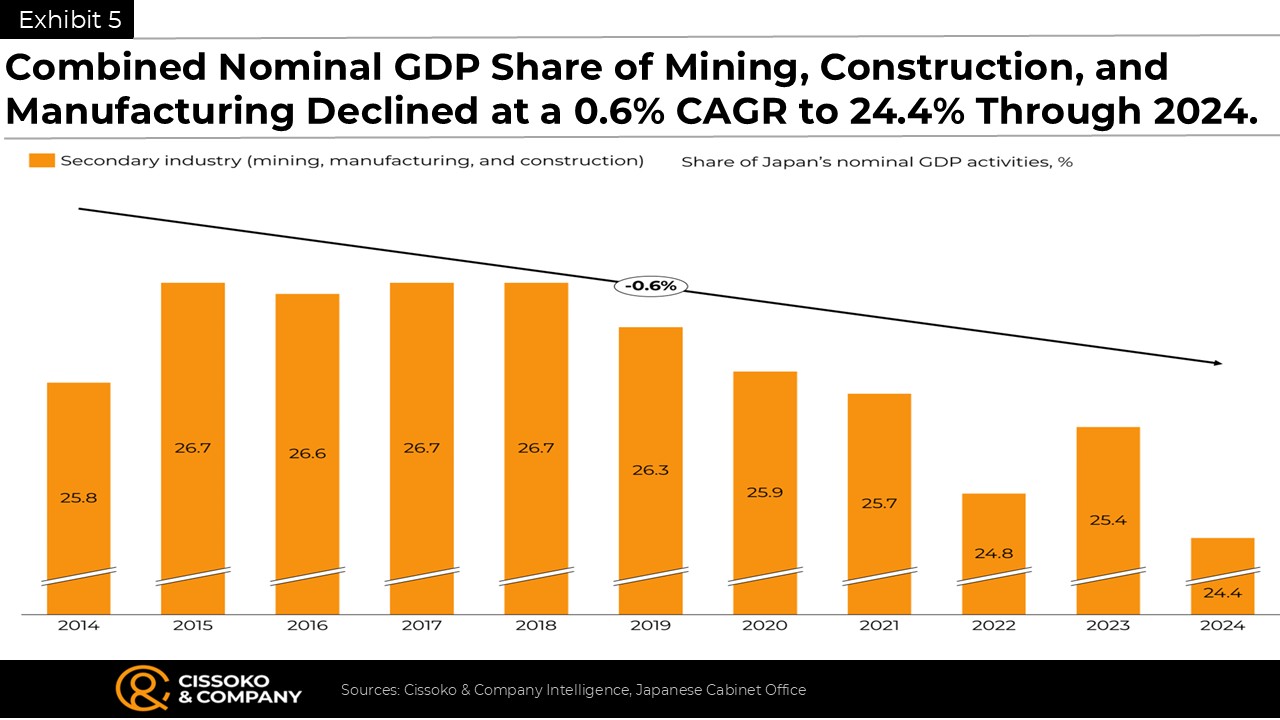
While sales have been growing modestly, remaining profitable in an inflationary environment presents formidable challenges, given the rising prices of many imported inputs, such as chemicals, coatings, and solvents, and of many products derived from the Middle East or petroleum. Like other major economies, Japan is not immune to the trends reshaping the global economy, including the increasing dominance of the service sector and the gradual erosion of manufacturing.
Japan’s GDP Trends Across the Tertiary Industries
By contrast, Japan’s tertiary industry, including technology, finance, and insurance, grew at a 0.2% CAGR over the same period, while the primary industry has struggled to boost overall productivity.
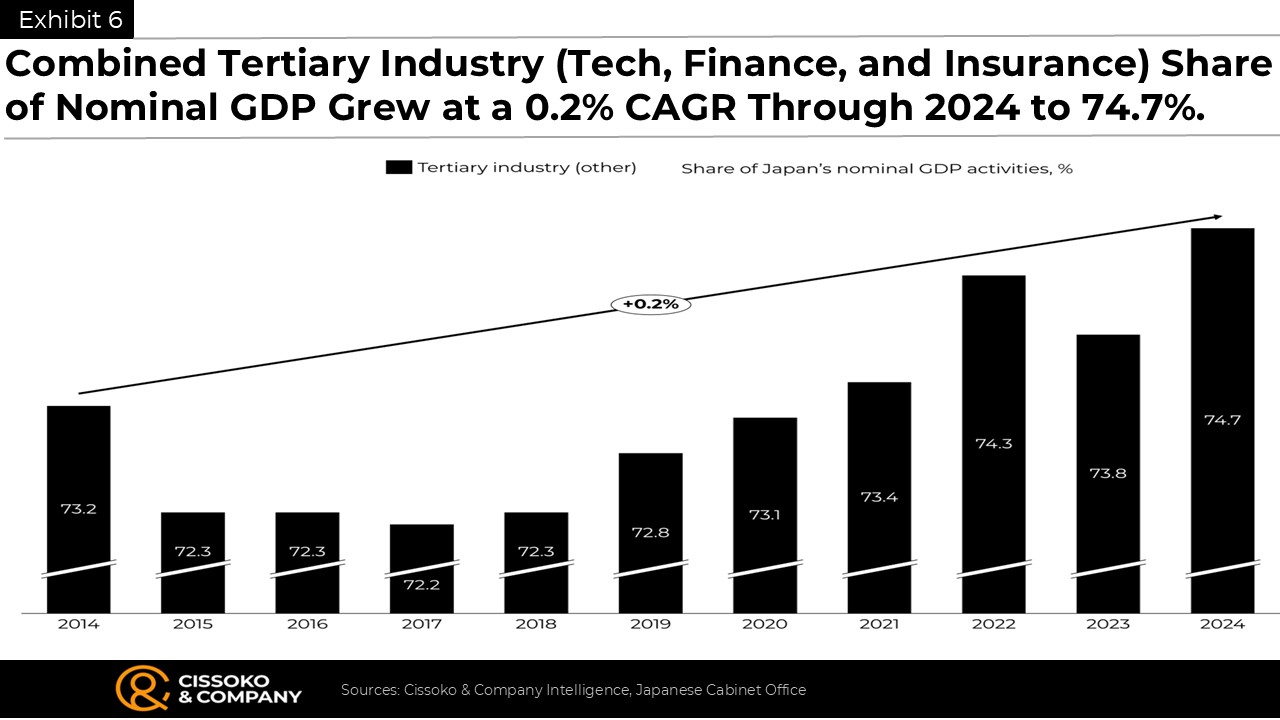
Indeed, many of the titans of the sector (the electronic giants) have been disrupted, particularly in the technology industry, as the global economy shifted and new challengers emerged worldwide, leaving a huge vacuum and a big shoe to fill in the digital age, given the rise of artificial intelligence-powered automation tools through large language models
Composition of Japan’s (Economy) Assets or net Worth
Shifting from GDP activities (flow account) to national wealth (stock account), the gap between the figures is so huge that when writing the figures, you need to double-check many times to avoid typos here and there.
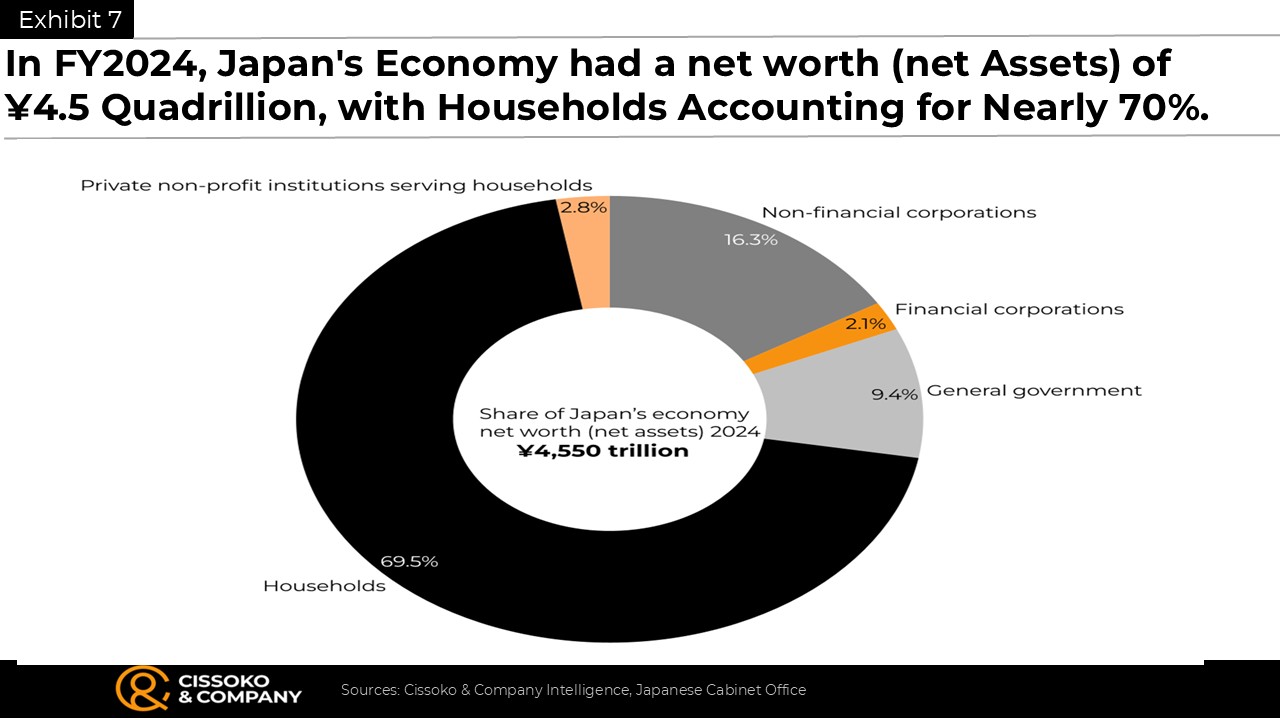
In other words, the gap between Japan’s GDP and its wealth is nearly seven times as large. That is, on average, over the period of our analysis, wealth (net assets) has been nearly seven times Japan’s GDP.
Trends in Japan’s (Economy) net Worth Over the Past Decade
Japan’s national wealth (net assets) has been growing faster than the country’s nominal gross domestic product (GDP).
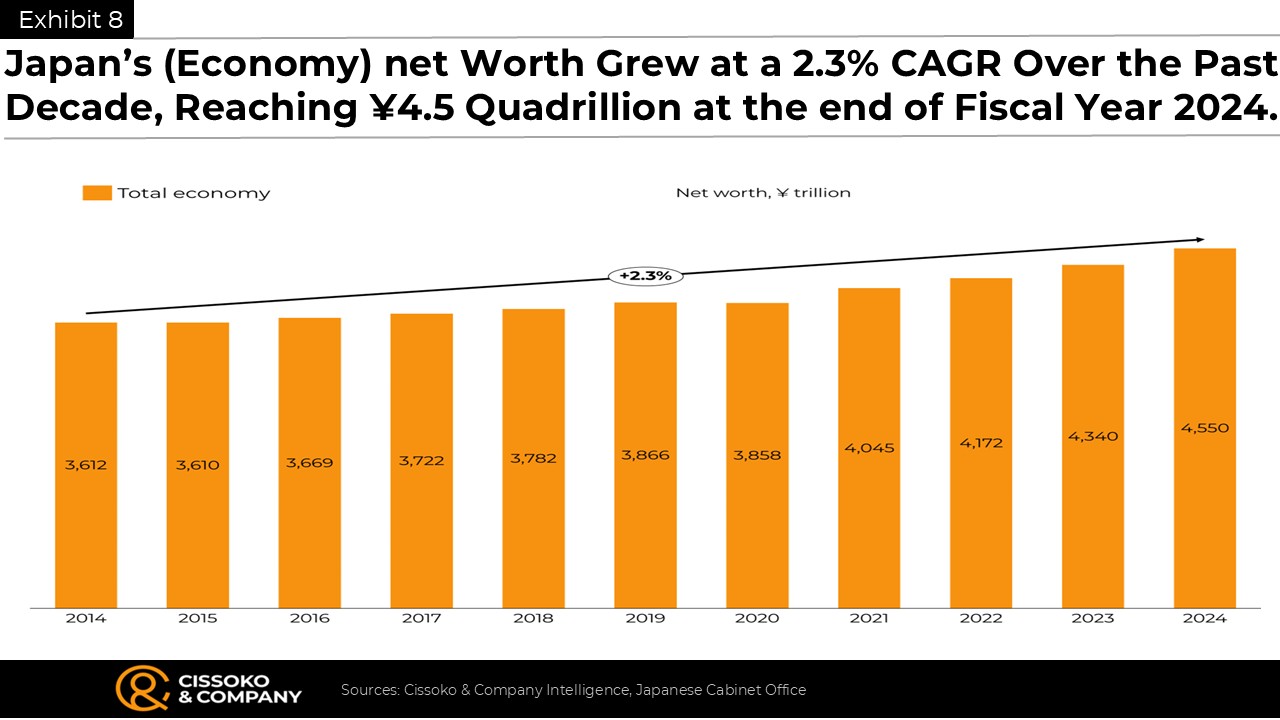
In other words, between 2010 and 2024, the country’s net worth grew at a 2% CAGR, compared with a 1.7% CAGR for GDP, reaching ¥4.5 quadrillion in 2024, a substantial figure by most comparisons.
Trends in net Worth of Financial Corporations
Wealth growth has not been evenly distributed; while some economic actors saw their wealth increase, financial corporations saw theirs decline.
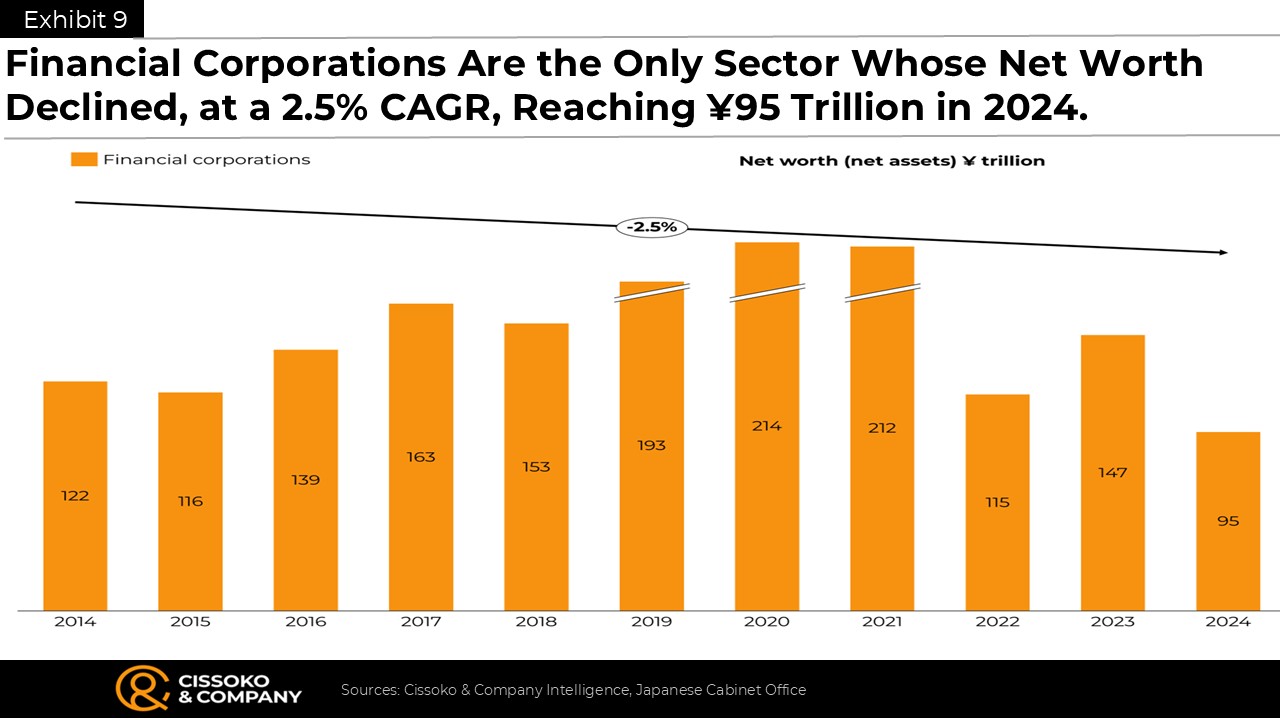
That is, from a whopping ¥122 trillion in 2014, their wealth evaporated at a compound rate of 2.5% to ¥95 trillion in 2024, a reduction of ¥27 trillion over the decade.
Trends in net Worth of Non-Financial Corporations
Unlike financial corporations, whose wealth has evaporated, non-financial corporations saw a major boost in wealth.
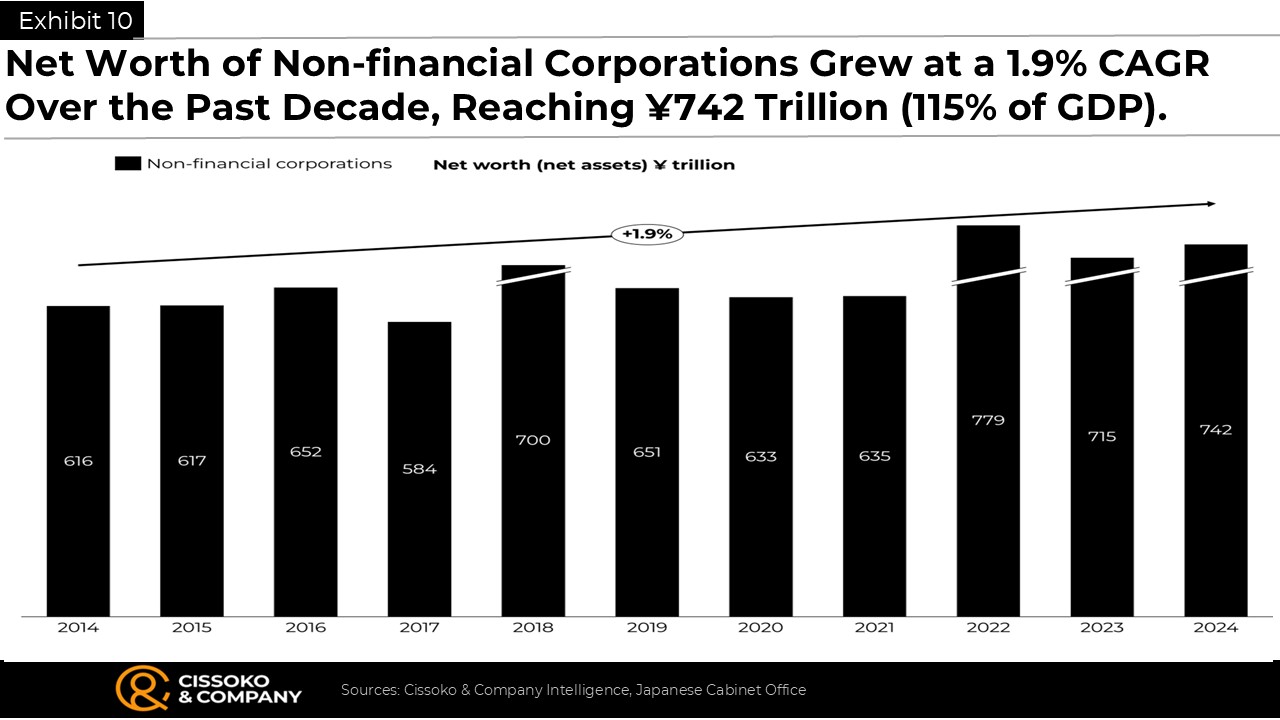
Their wealth grew at a compound annual growth rate (CAGR) of 1.9%, reaching a staggering ¥745 trillion, equivalent to 115% of the country’s GDP. In other words, non-financial corporations added over a decade’s worth of ¥126 trillion to their wealth.
Japan’s General Government Wealth Trends
Among the main economic players, Japan’s general government saw the highest compounded wealth growth rate over the same period. Its wealth grew at a 7.6% CAGR to ¥427 trillion. In other words, between 2014 and 2024, it more than doubled its 2014 wealth level, an impressive feat in this era of uncertainty.
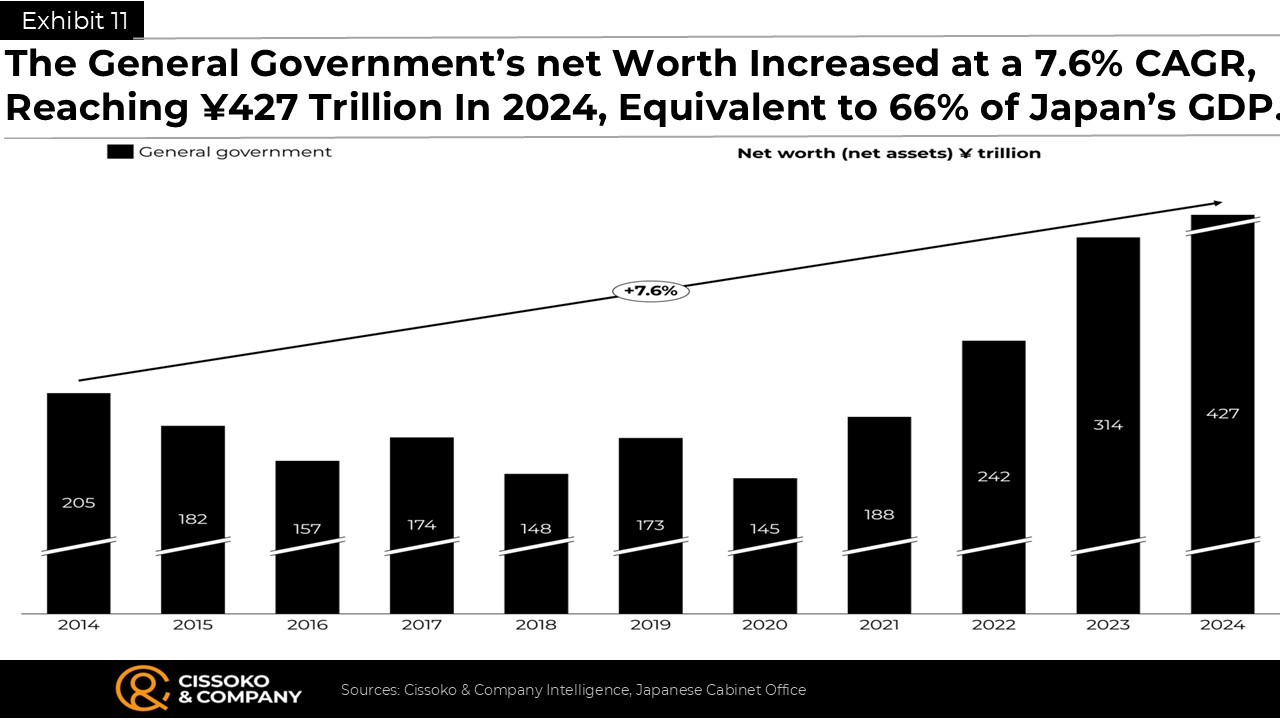
In fact, no economic actors on the list came closer to Japan’s general government’s wealth-building machine, which is gradually approaching the size of Japan’s entire gross domestic product (GDP).
Japanese Households’ net Worth (Wealth) Trends in Recent Years
Japanese households are the wealthiest among the main economic players discussed so far. Over the decade through 2024, their wealth grew at a compound annual growth rate (CAGR) of 2.1%, reaching a whopping \3.1 quadrillion.
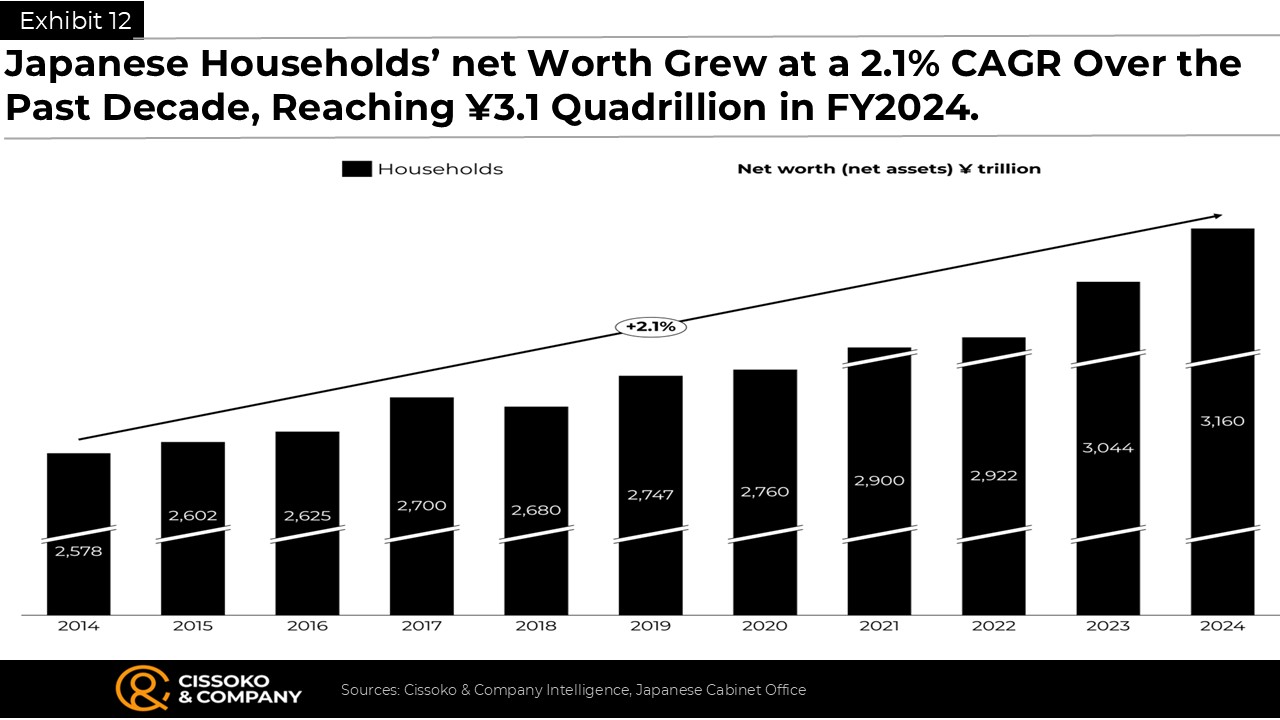
That means Japanese households have added over ¥580 trillion to their wealth over the past decade.
Private Nonprofits’ net Worth Trends Over the Past Decade
Finally, the smallest among the main economic actors is the private non-profits serving households across the country.
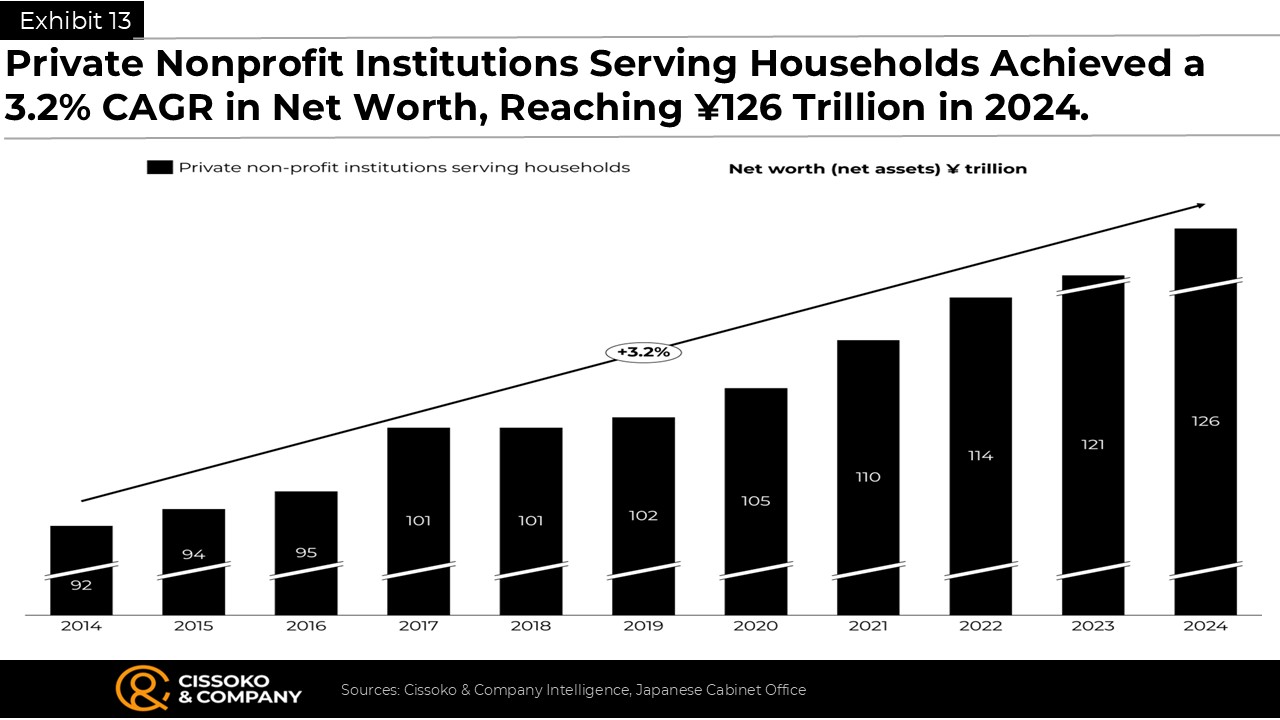
Though small, their wealth grew at a 3.2% CAGR over the past decade, reaching 126 trillion in 2024, a figure that exceeds the total profits of Japanese firms in fiscal year 2023-24.
Japan’s Public Debt-to-GDP Trends
Japan’s total public debt-to-GDP ratio is among the highest among the wealthiest countries. However, a deeper analysis suggests this burden is not as severe as many critics believe.
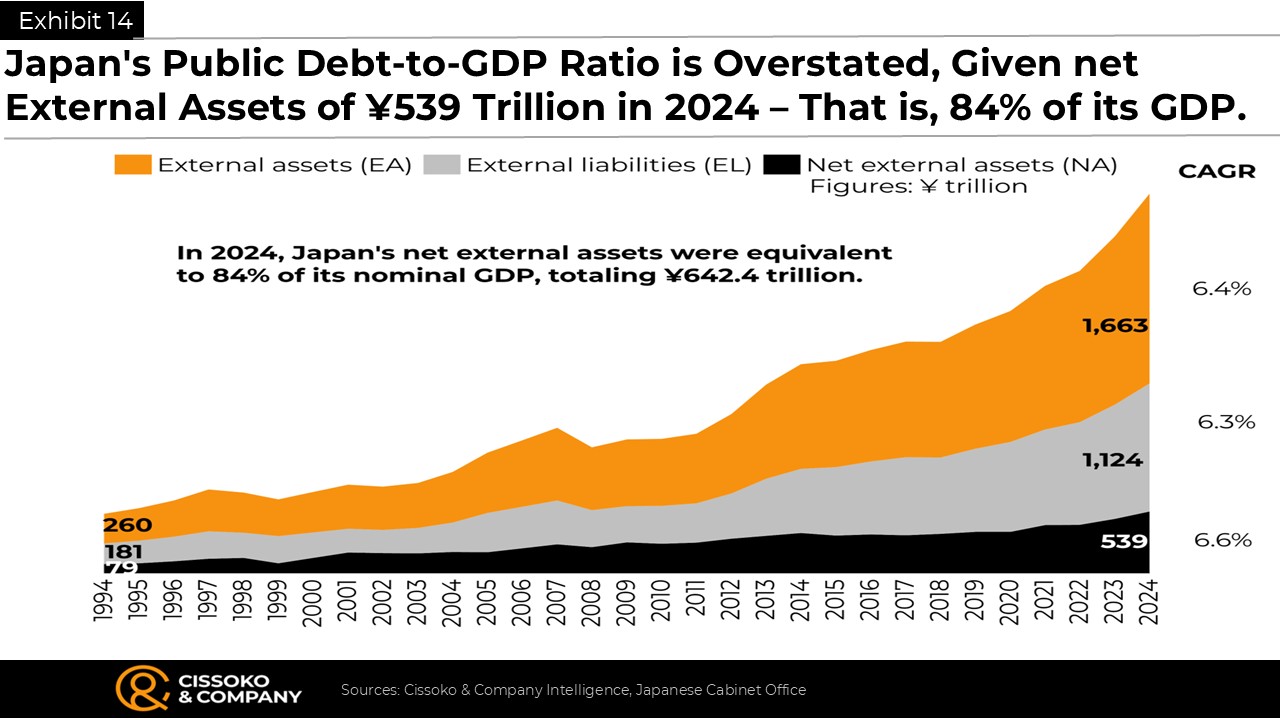
For one thing, Japan’s external net assets reached ¥ 539 trillion in 2024 – equivalent to 84% of the country’s nominal GDP (¥ 642 trillion). In other words, deducting these external assets from total public liabilities yields a figure similar to that of many other developed economies.
In a nutshell, this report discusses two of the three major pillars of the Japanese economy: net assets (wealth) and gross domestic product. The other one is the gross output, which is total national sales, which we have written a lot about elsewhere on our website (click on the tag report to learn more about that pillar.
Get in Touch
We will respond to your message as soon as possible.
Insights to Win
Subscribe to our newsletter for in-depth analysis, reports, and our perspectives on business and economic issues related to the Japanese market and the global economy.