
Most Profitable Japanese Industries: Japan’s Profitability® Medalists™ for Q2 2026 — Who’s Who? REPORT
Most Profitable Industries: Japan’s Profitability® Medalists™ for Q2 2026. DOWNLOAD the 76-PAGE REPORT HERE.
While many companies and their CEOs were still weighing how to deploy and scale agentic AI, many Japanese industries and firms were already generating substantial profits, with or without it.
Equity markets, from the S&P 500 to the Nasdaq to the Nikkei 225, have recently been disrupted, with many now in correction territory.
Anthropic’s landmark IPO and Nvidia’s strong earnings did little to ease investor concerns about risks across the AI ecosystem, from threats to data center ongoing projects to runaway debt to elevated valuations. Another concern for CEOs and business leaders in SoftBank’s, Toyota’s, and MUFG’s home market is the risk to Japan’s $900 billion profit pool in 2026.
In Q2 2026 alone, firms of all sizes generated more than $300 billion in the Land of the Rising Sun. The answer business leaders need to know is: Which industries emerged as the winners worthy of our awards? In other words, which Japanese industries earned Japan’s Profitability® Medalists™ Awards in Q2 2026? First, how has Japan’s profitability landscape evolved in recent quarters?
The Booming Japan Profitability Landscape
The threshold for our prestigious Japan’s Profitability Medalist™ designation rose in Q2 2026 versus Q1, reflecting stronger overall profitability growth across Japanese industries.
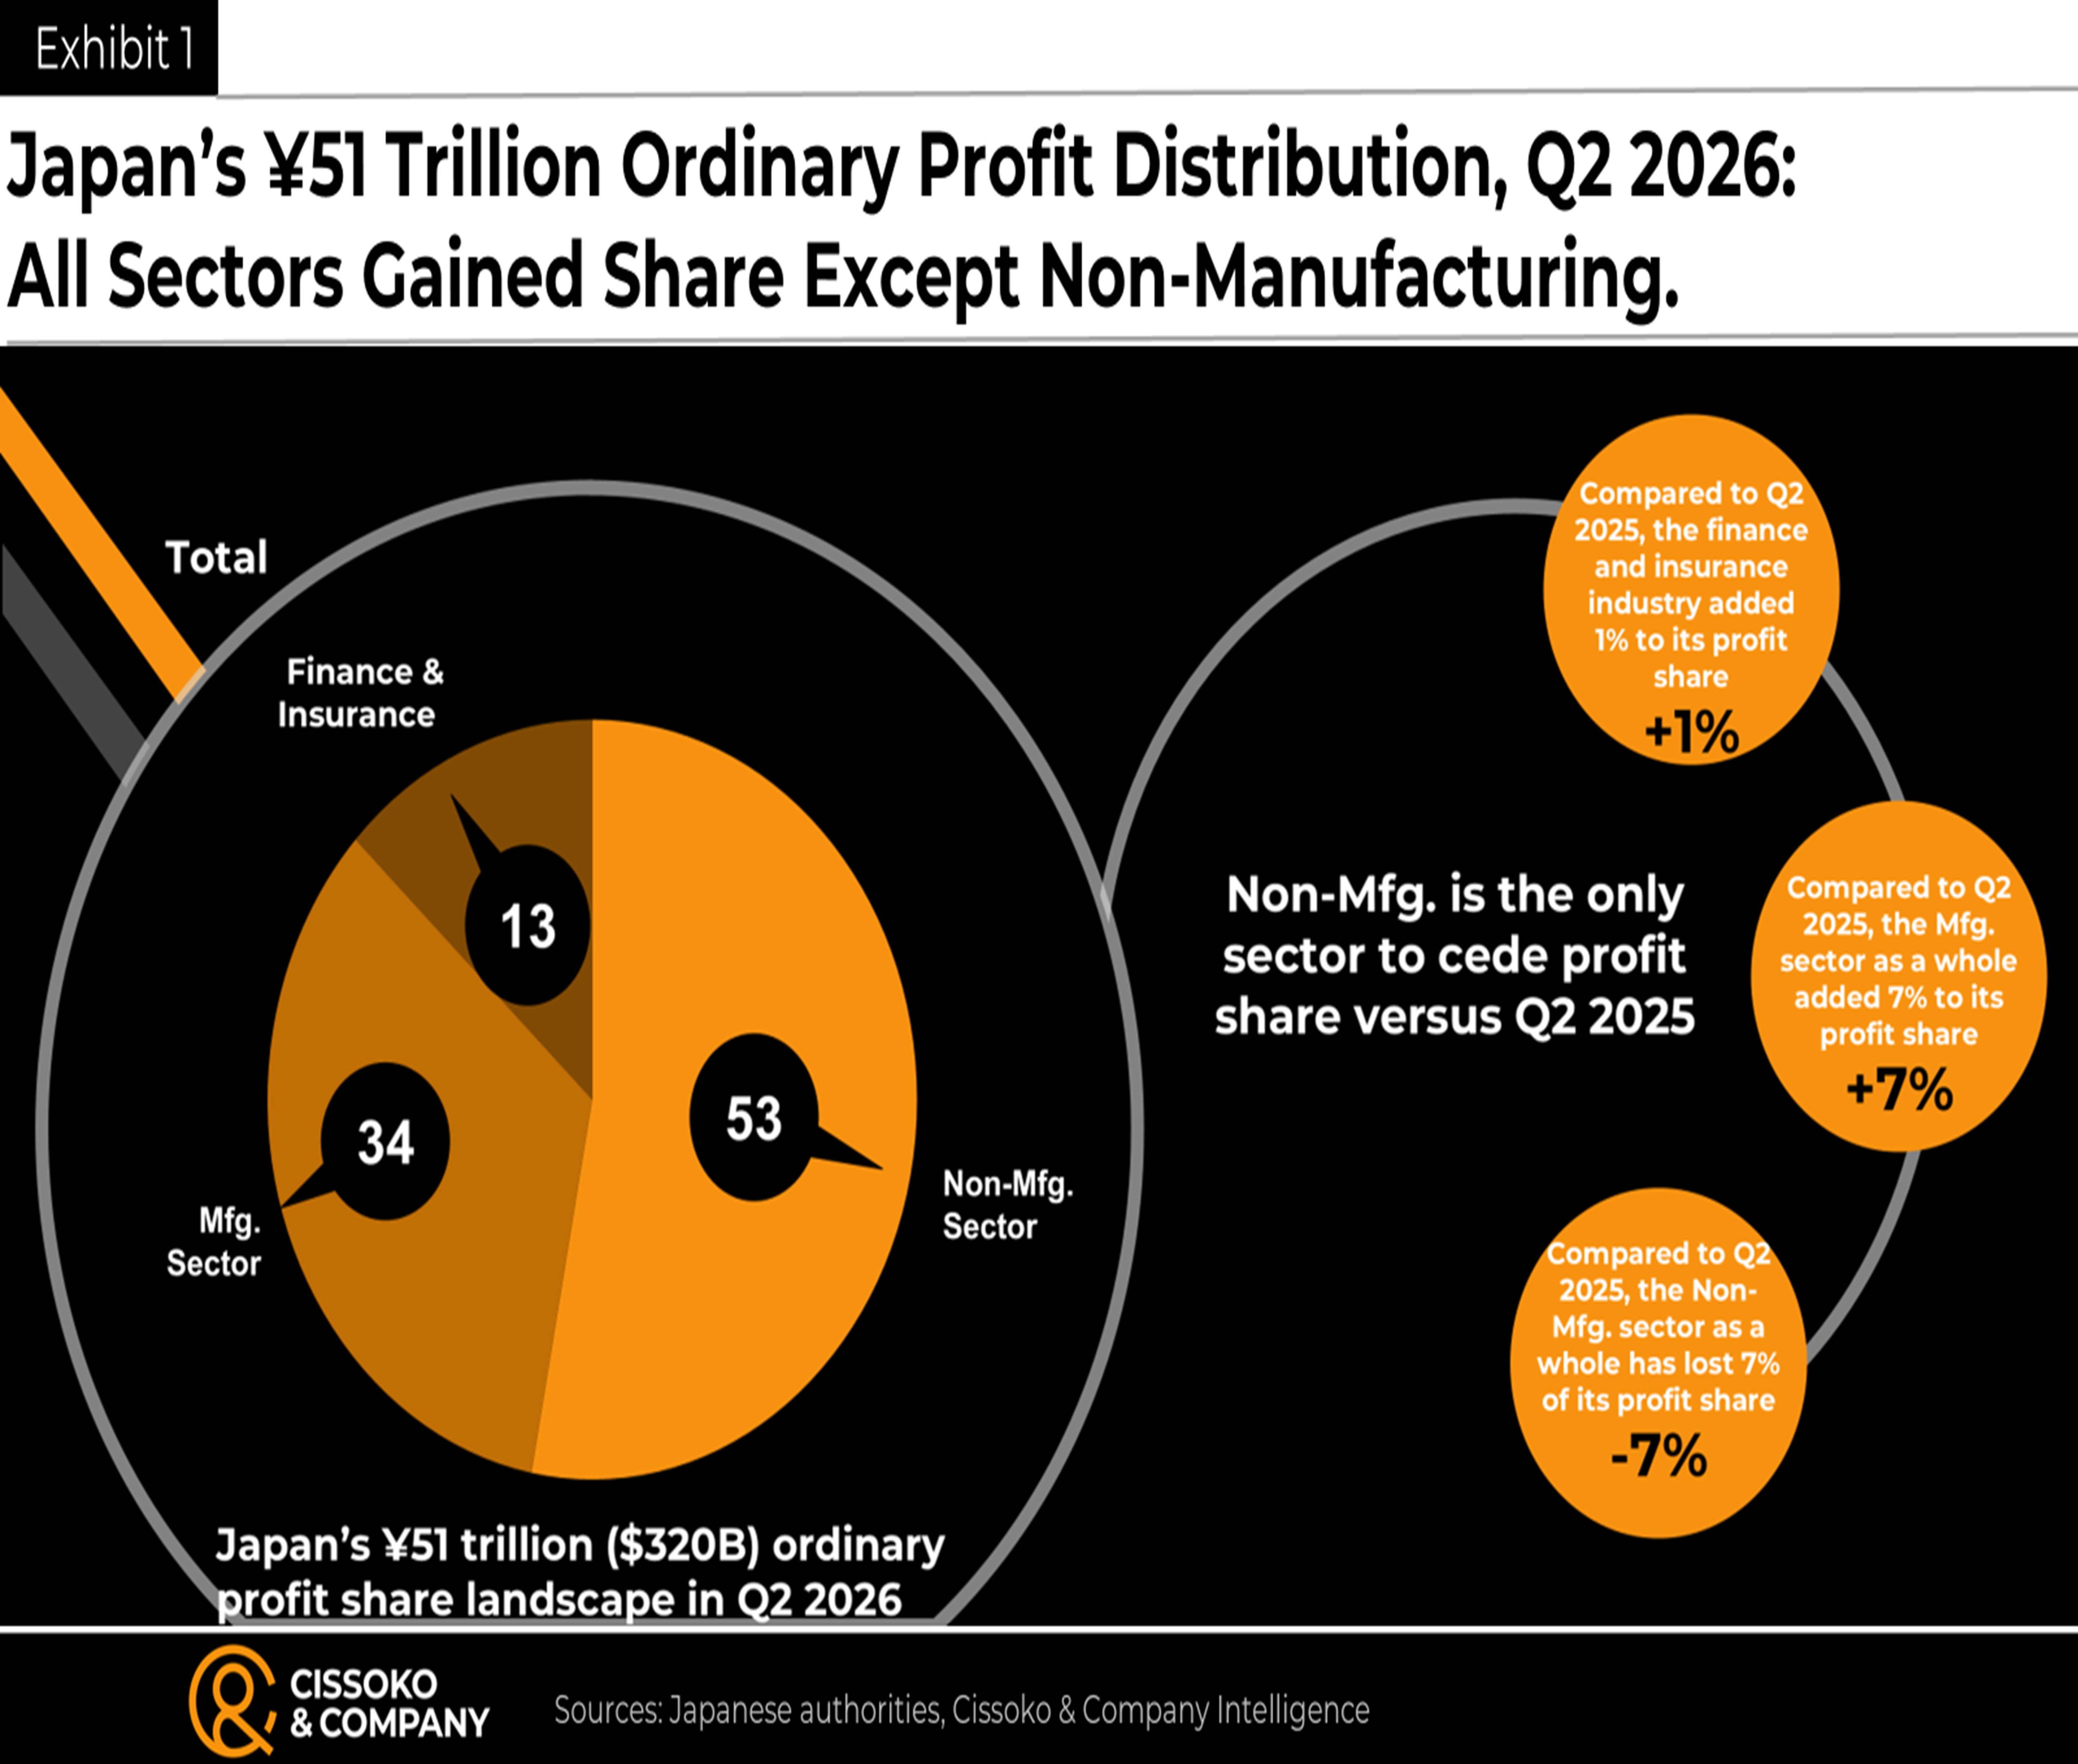
Companies of all sizes across manufacturing and non-manufacturing sectors generated ¥51 trillion ($320 billion) in total ordinary profit, up ¥14 trillion from Q1 2026. Consequently, both the minimum and definitive qualifying industry profit growth thresholds for the designation increased relative to Q1.
The Minimum and Definitive Qualifying Profit Growth Rate in Q2 2026
Indeed, the minimum qualifying industry profit growth threshold—which includes all Japanese industries except the finance and insurance industry—is 25%, up 10 percentage points from the first quarter.
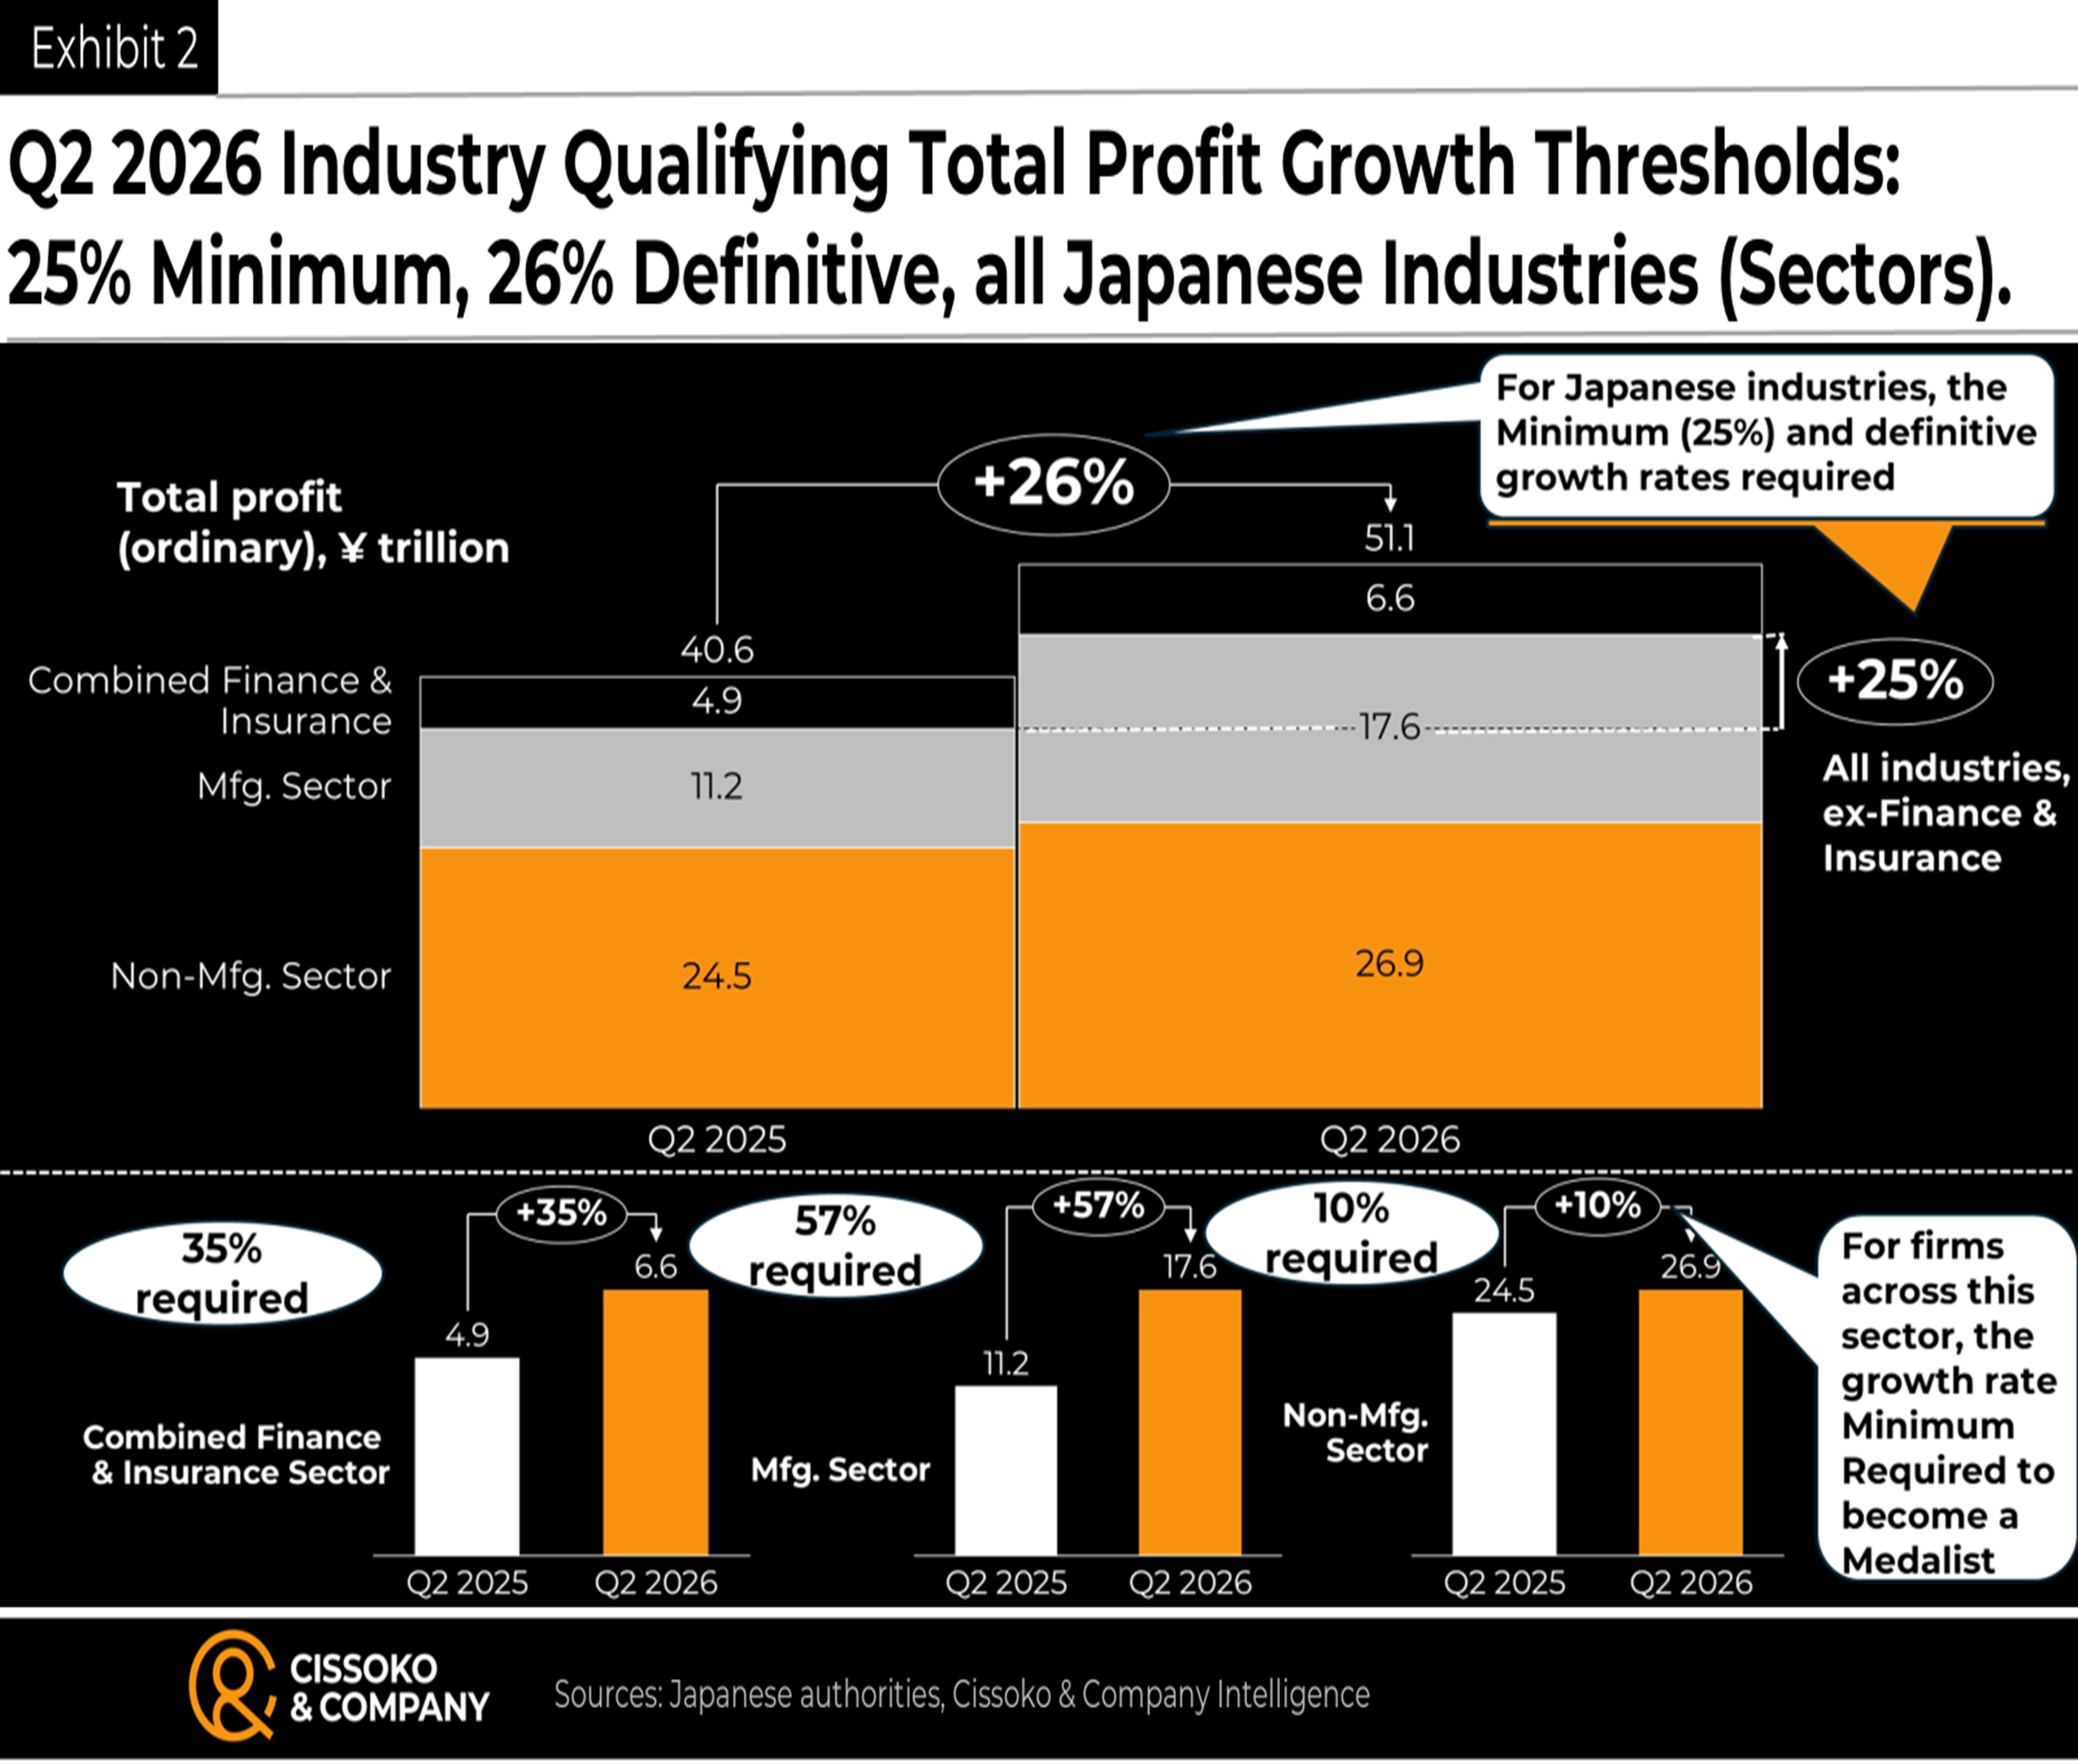
Similarly, the definitive qualifying threshold—which includes all Japanese industries—is 26%, up four percentage points from the first quarter.
The Profitability Paradox: Why Minimum and Definitive Growth Thresholds Are Critical
What separates the Profitability® Medalists™ from merely profitable firms or industries? According to our five-year research, the latter’s profit growth rate fails to sustain their share of industry or national profits, while medalists sustain or expand theirs because their total profit growth rates consistently beat the minimum required growth rate.
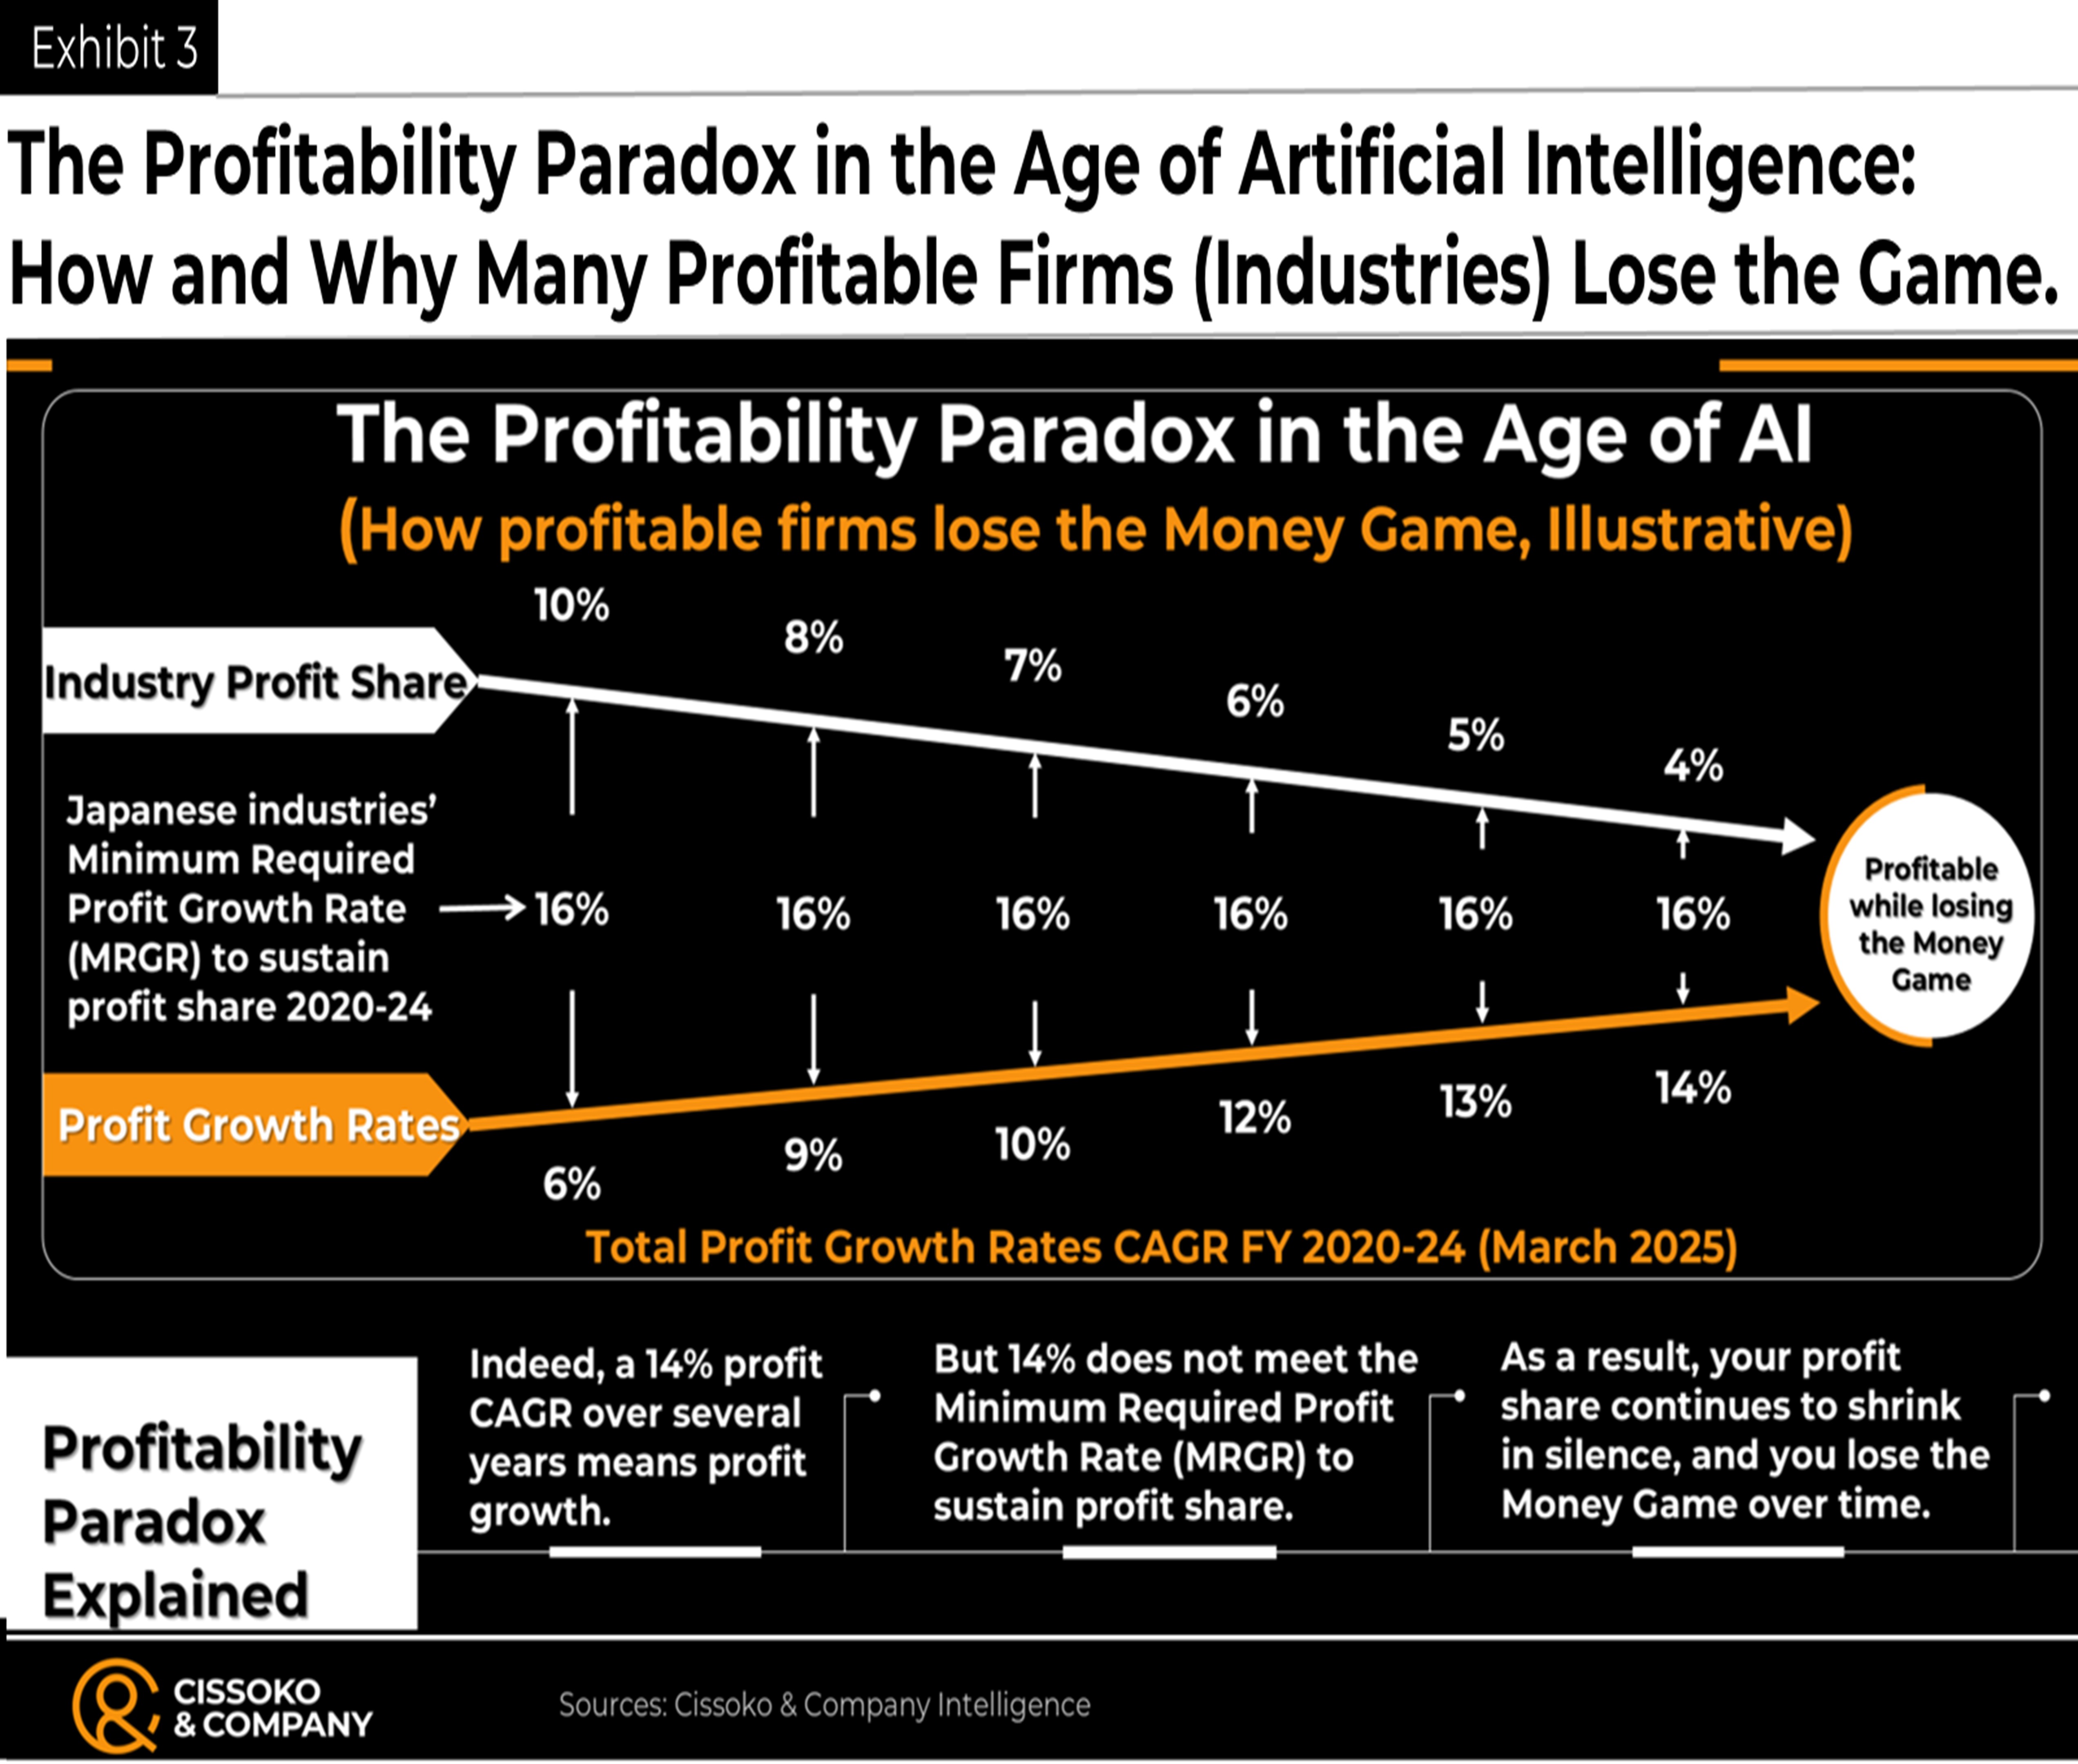
The central question: how do profitable firms or industries steadily cede profit share, unnoticed by CEOs and analysts? This report examines the mechanics of the profitability paradox through a case study of Japan’s non-life insurers (download the report here).
The 15 Industries That Fell Short of the Minimum Qualifying Total Profit Growth Rate Required (25%)
Our inaugural Q1 2026 report did not list the industries that fell short of Japan’s Profitability® Medalist™ designation, nor the total profit growth rates explaining the shortfall. Going forward, each report will present these industries before announcing the winners across all major industries nationwide.
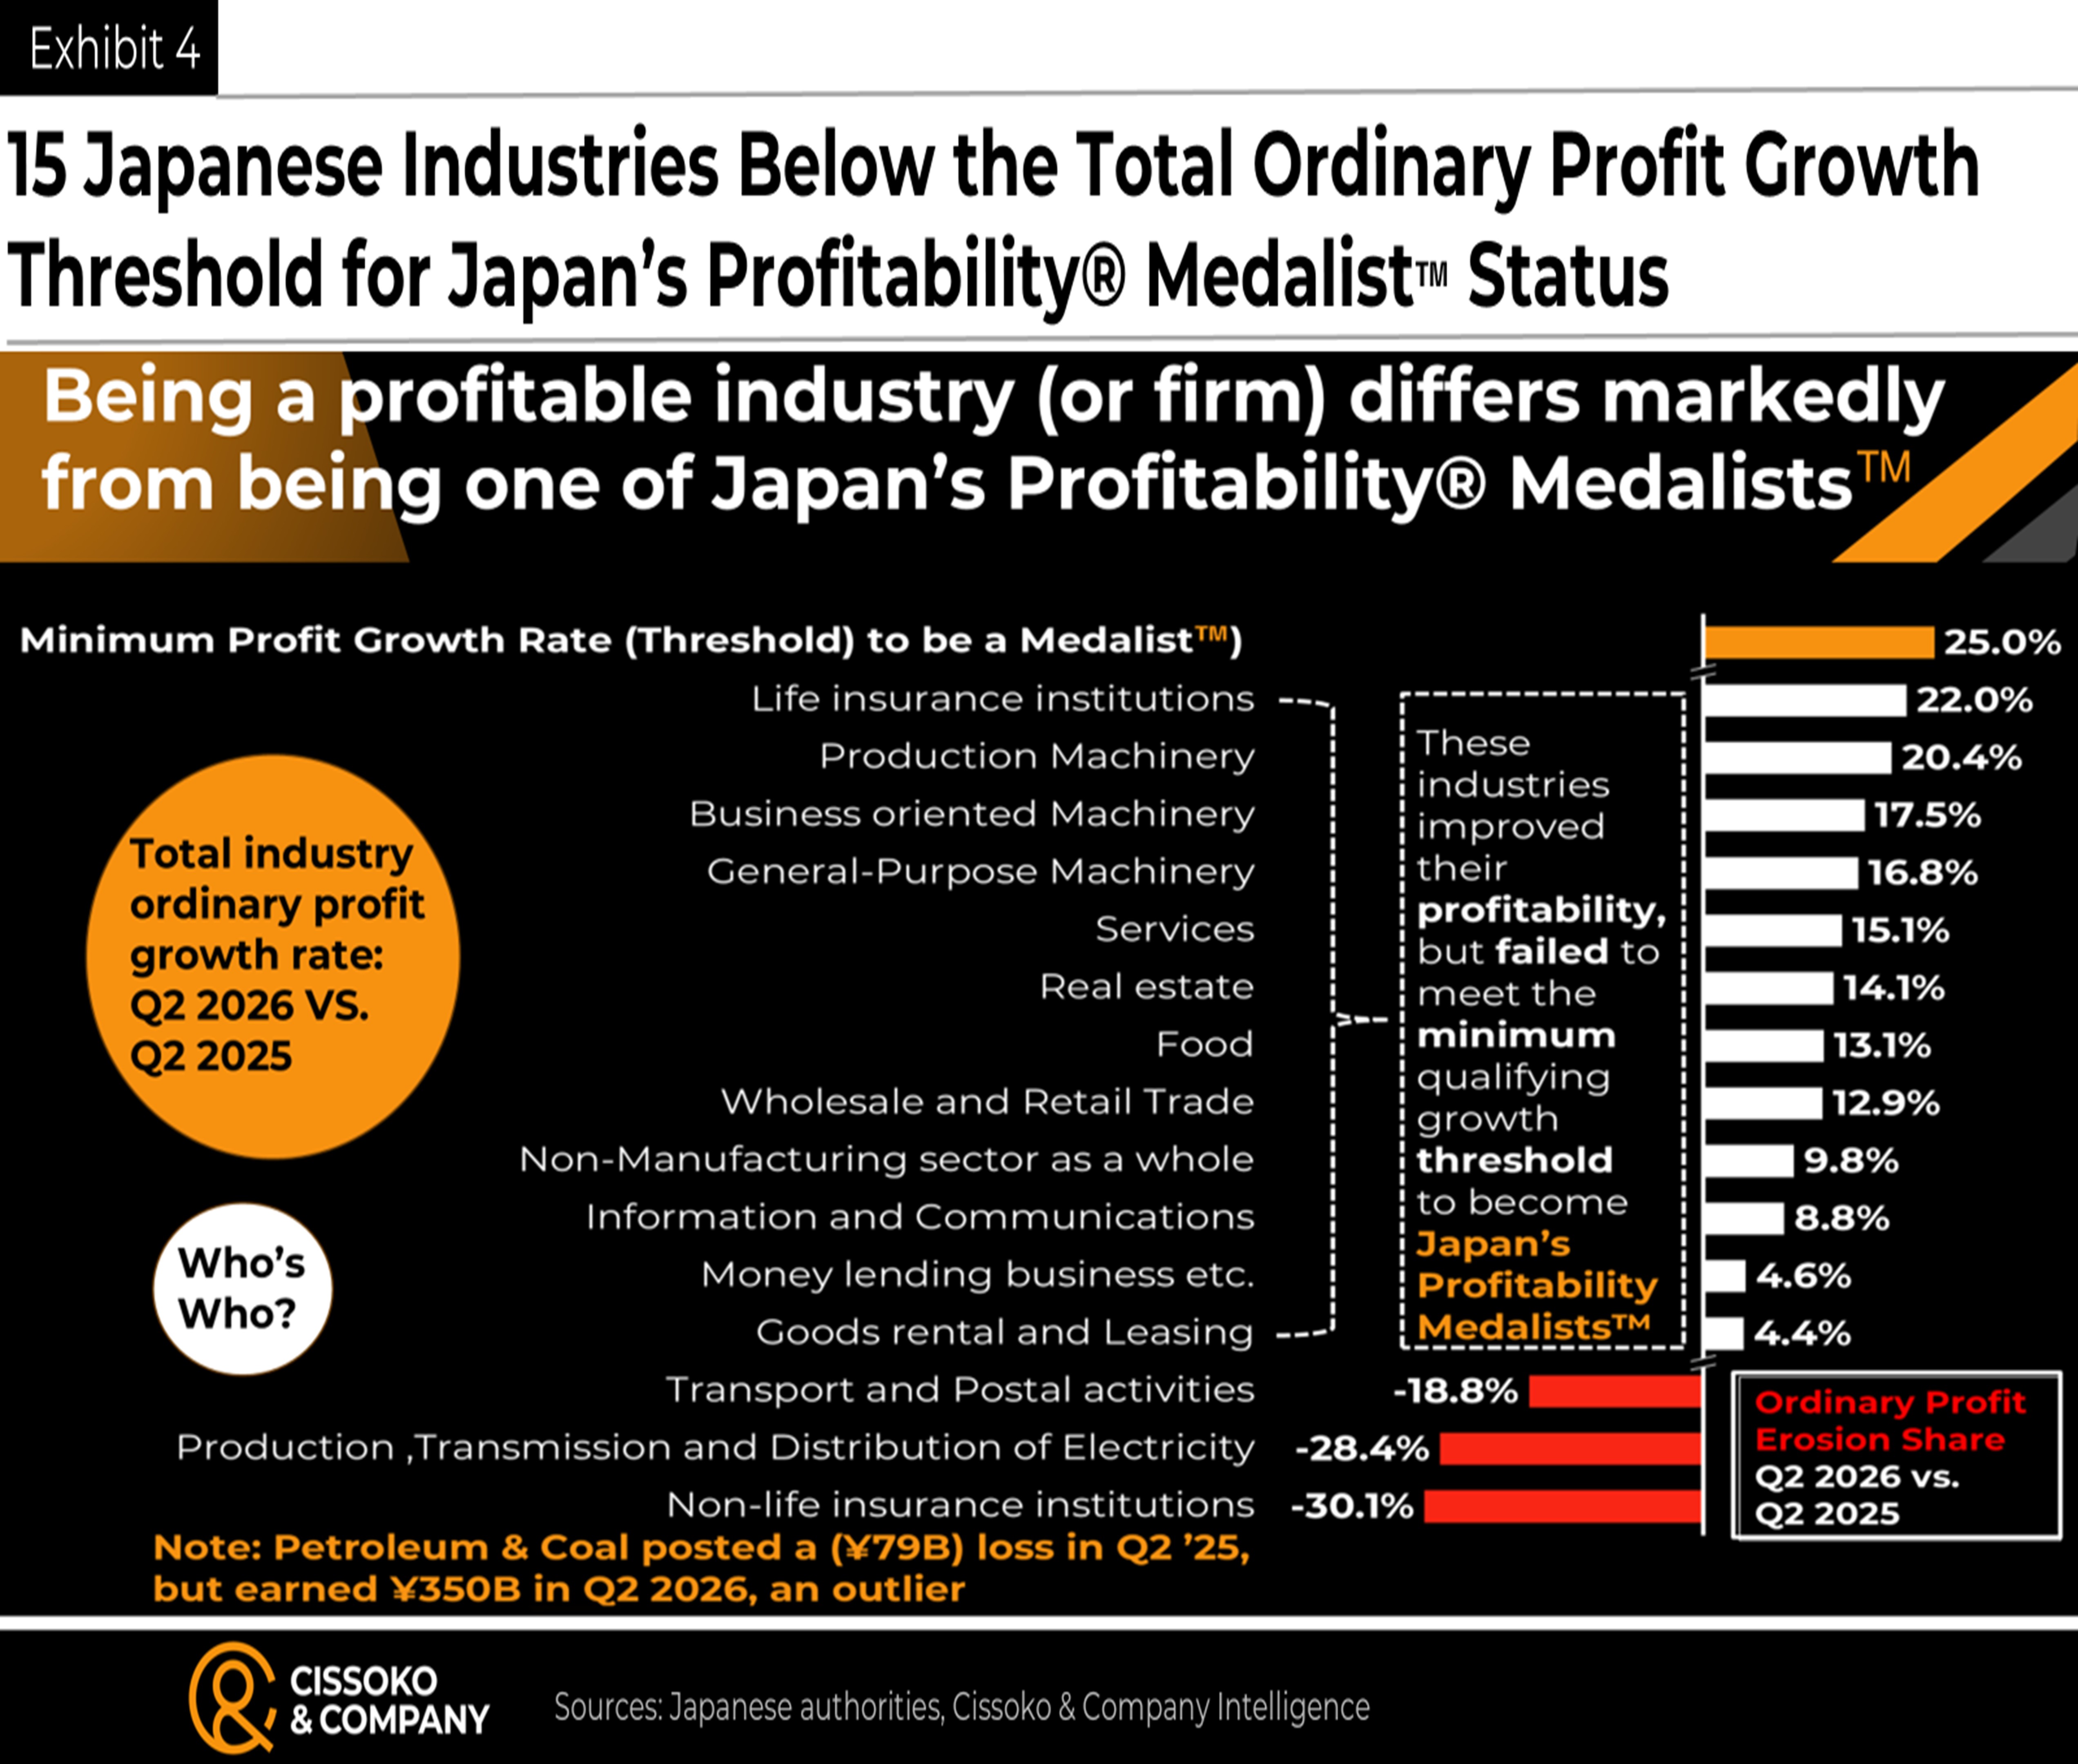
Accordingly, this report presents the performance of all 25 industries, including three major sectors, demonstrating transparently why the winners merit recognition.
Japan’s Profitability® Medalists™ for Q2 2026
In total, 13 industries, including two major sectors and spanning finance and insurance, manufacturing, and non-manufacturing, met both the minimum and definitive total industry profit growth thresholds to qualify as Japan’s Profitability® Medalists™ for Q2 2026.
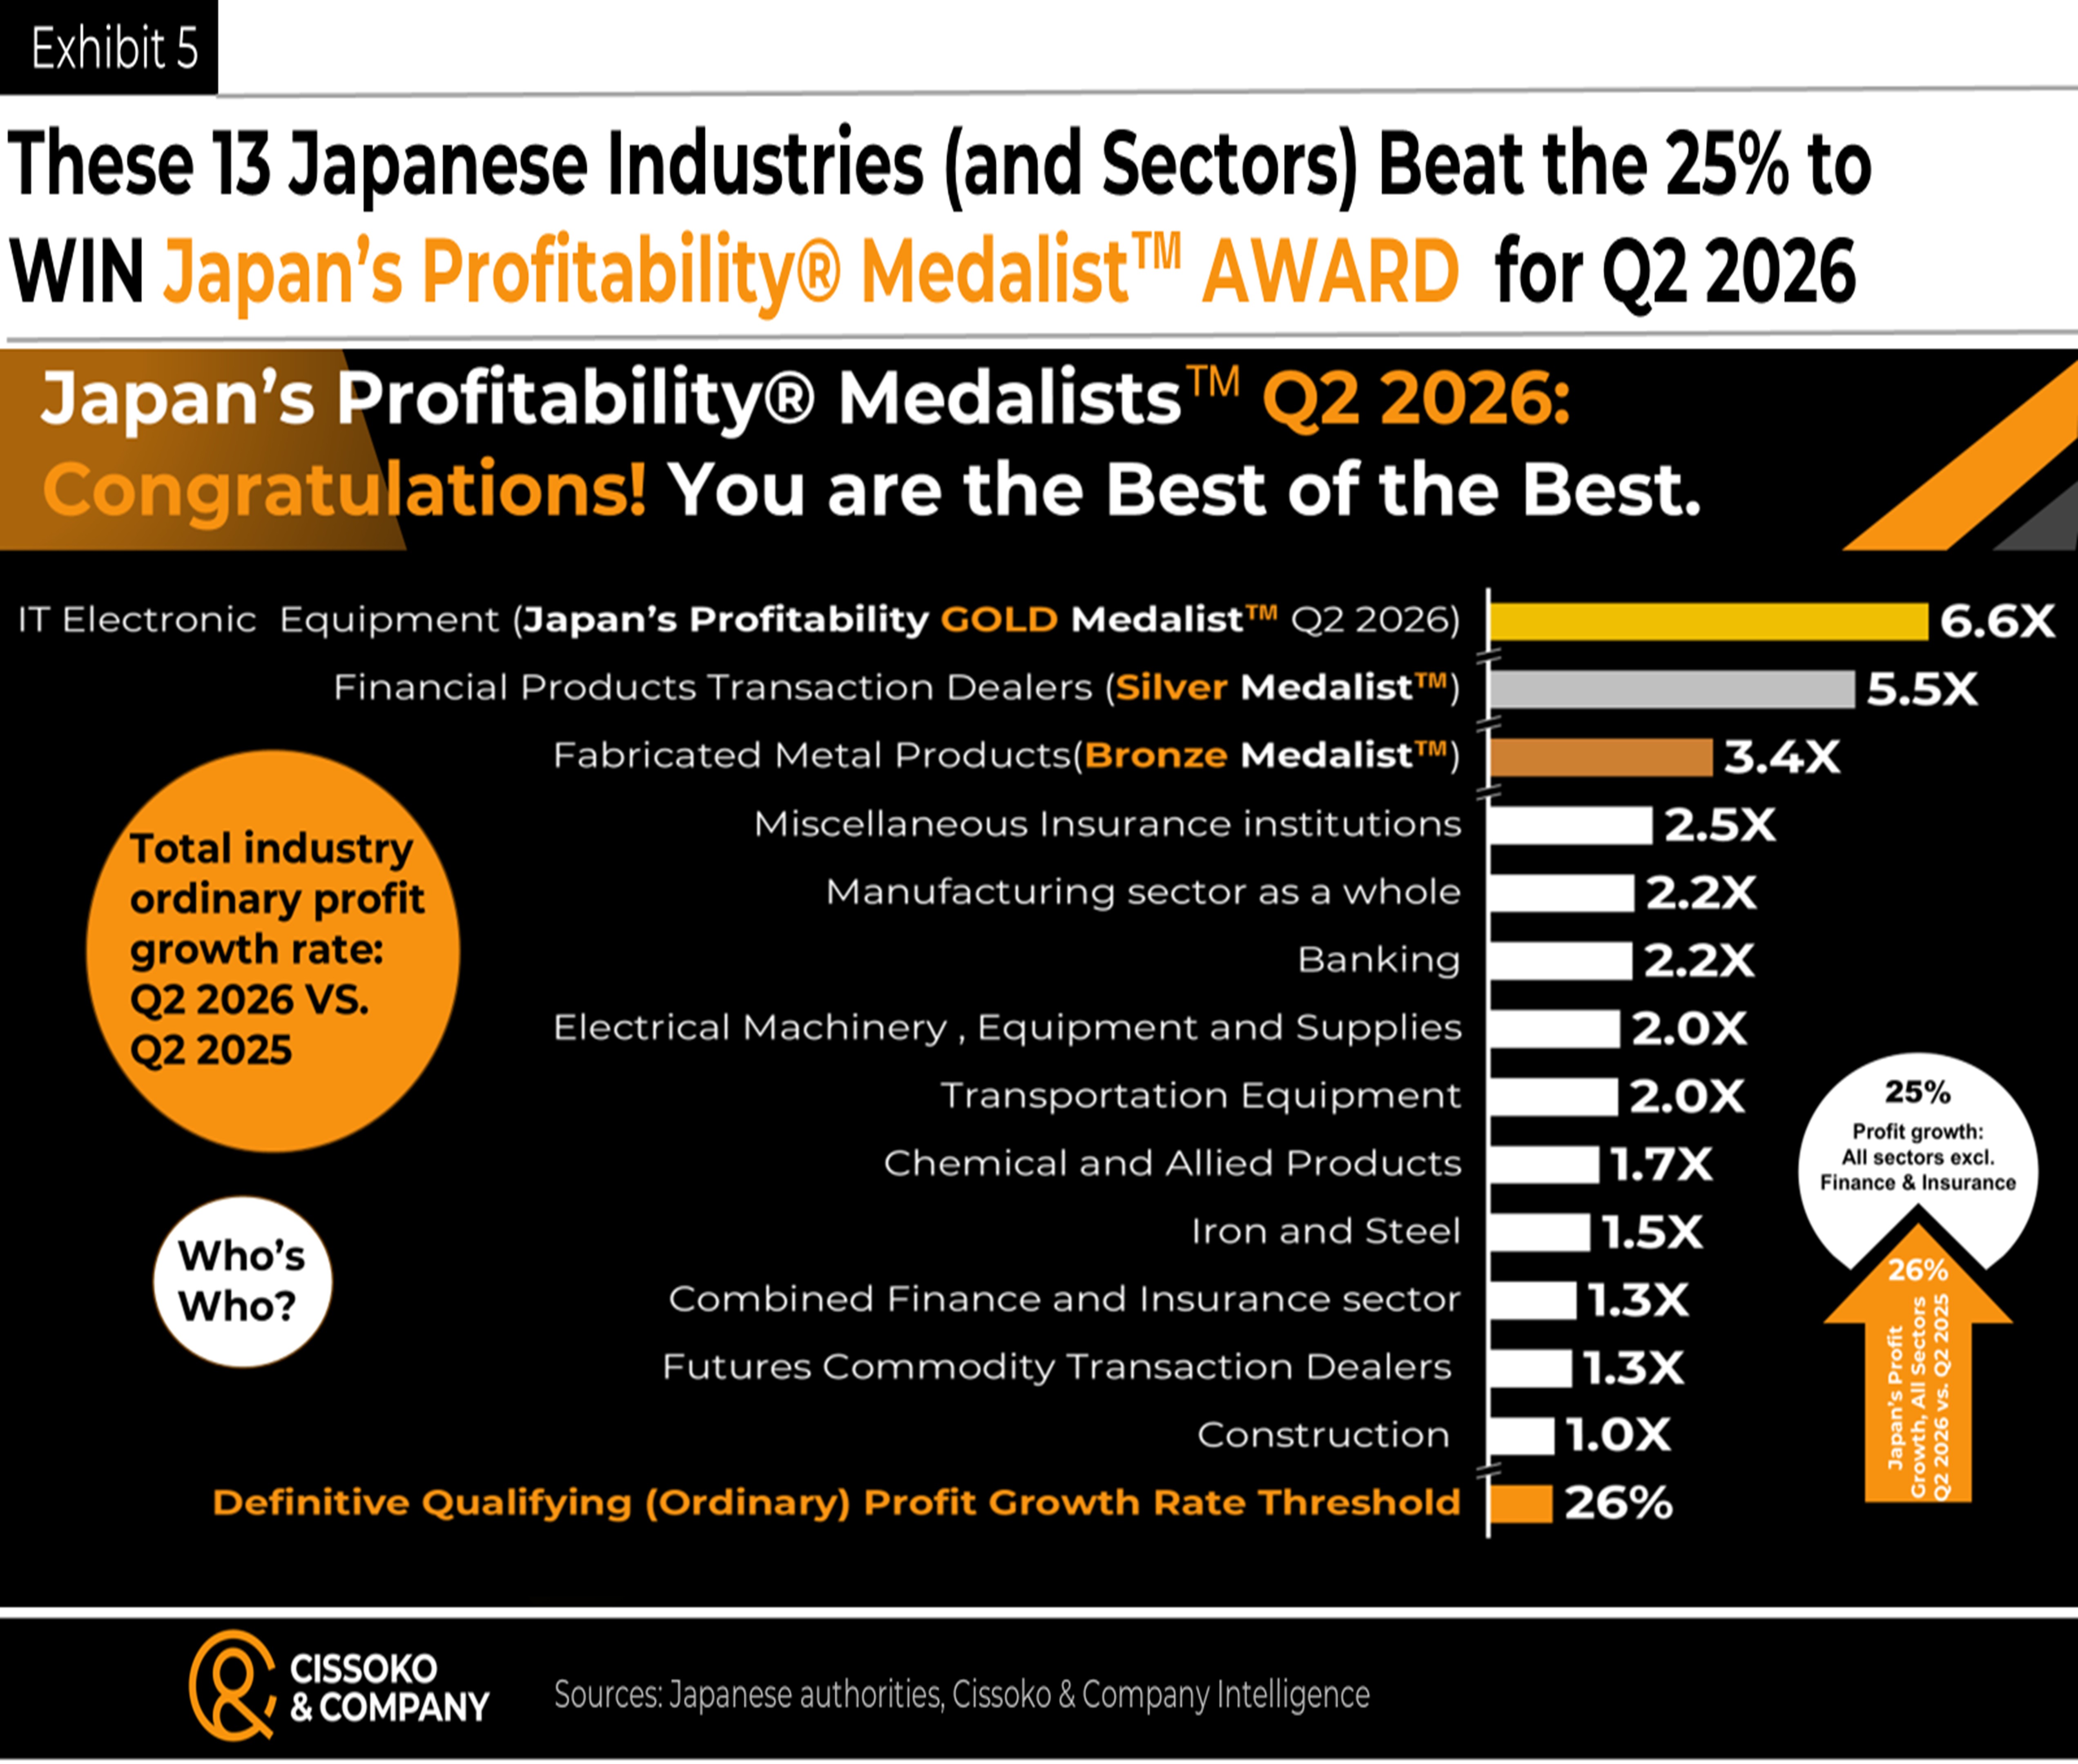
Profit growth performance varies widely, from industries narrowly meeting the minimum, such as construction, to the top three winners’ double- and triple-digit growth rates.
Japan’s Profitability® Gold, Silver, and Bronze Medalists™ for Q2 2026
Among Japan’s Profitability Medalists™ for Q2 2026, three industries outperform the rest by a significant margin. The three leading industries are:
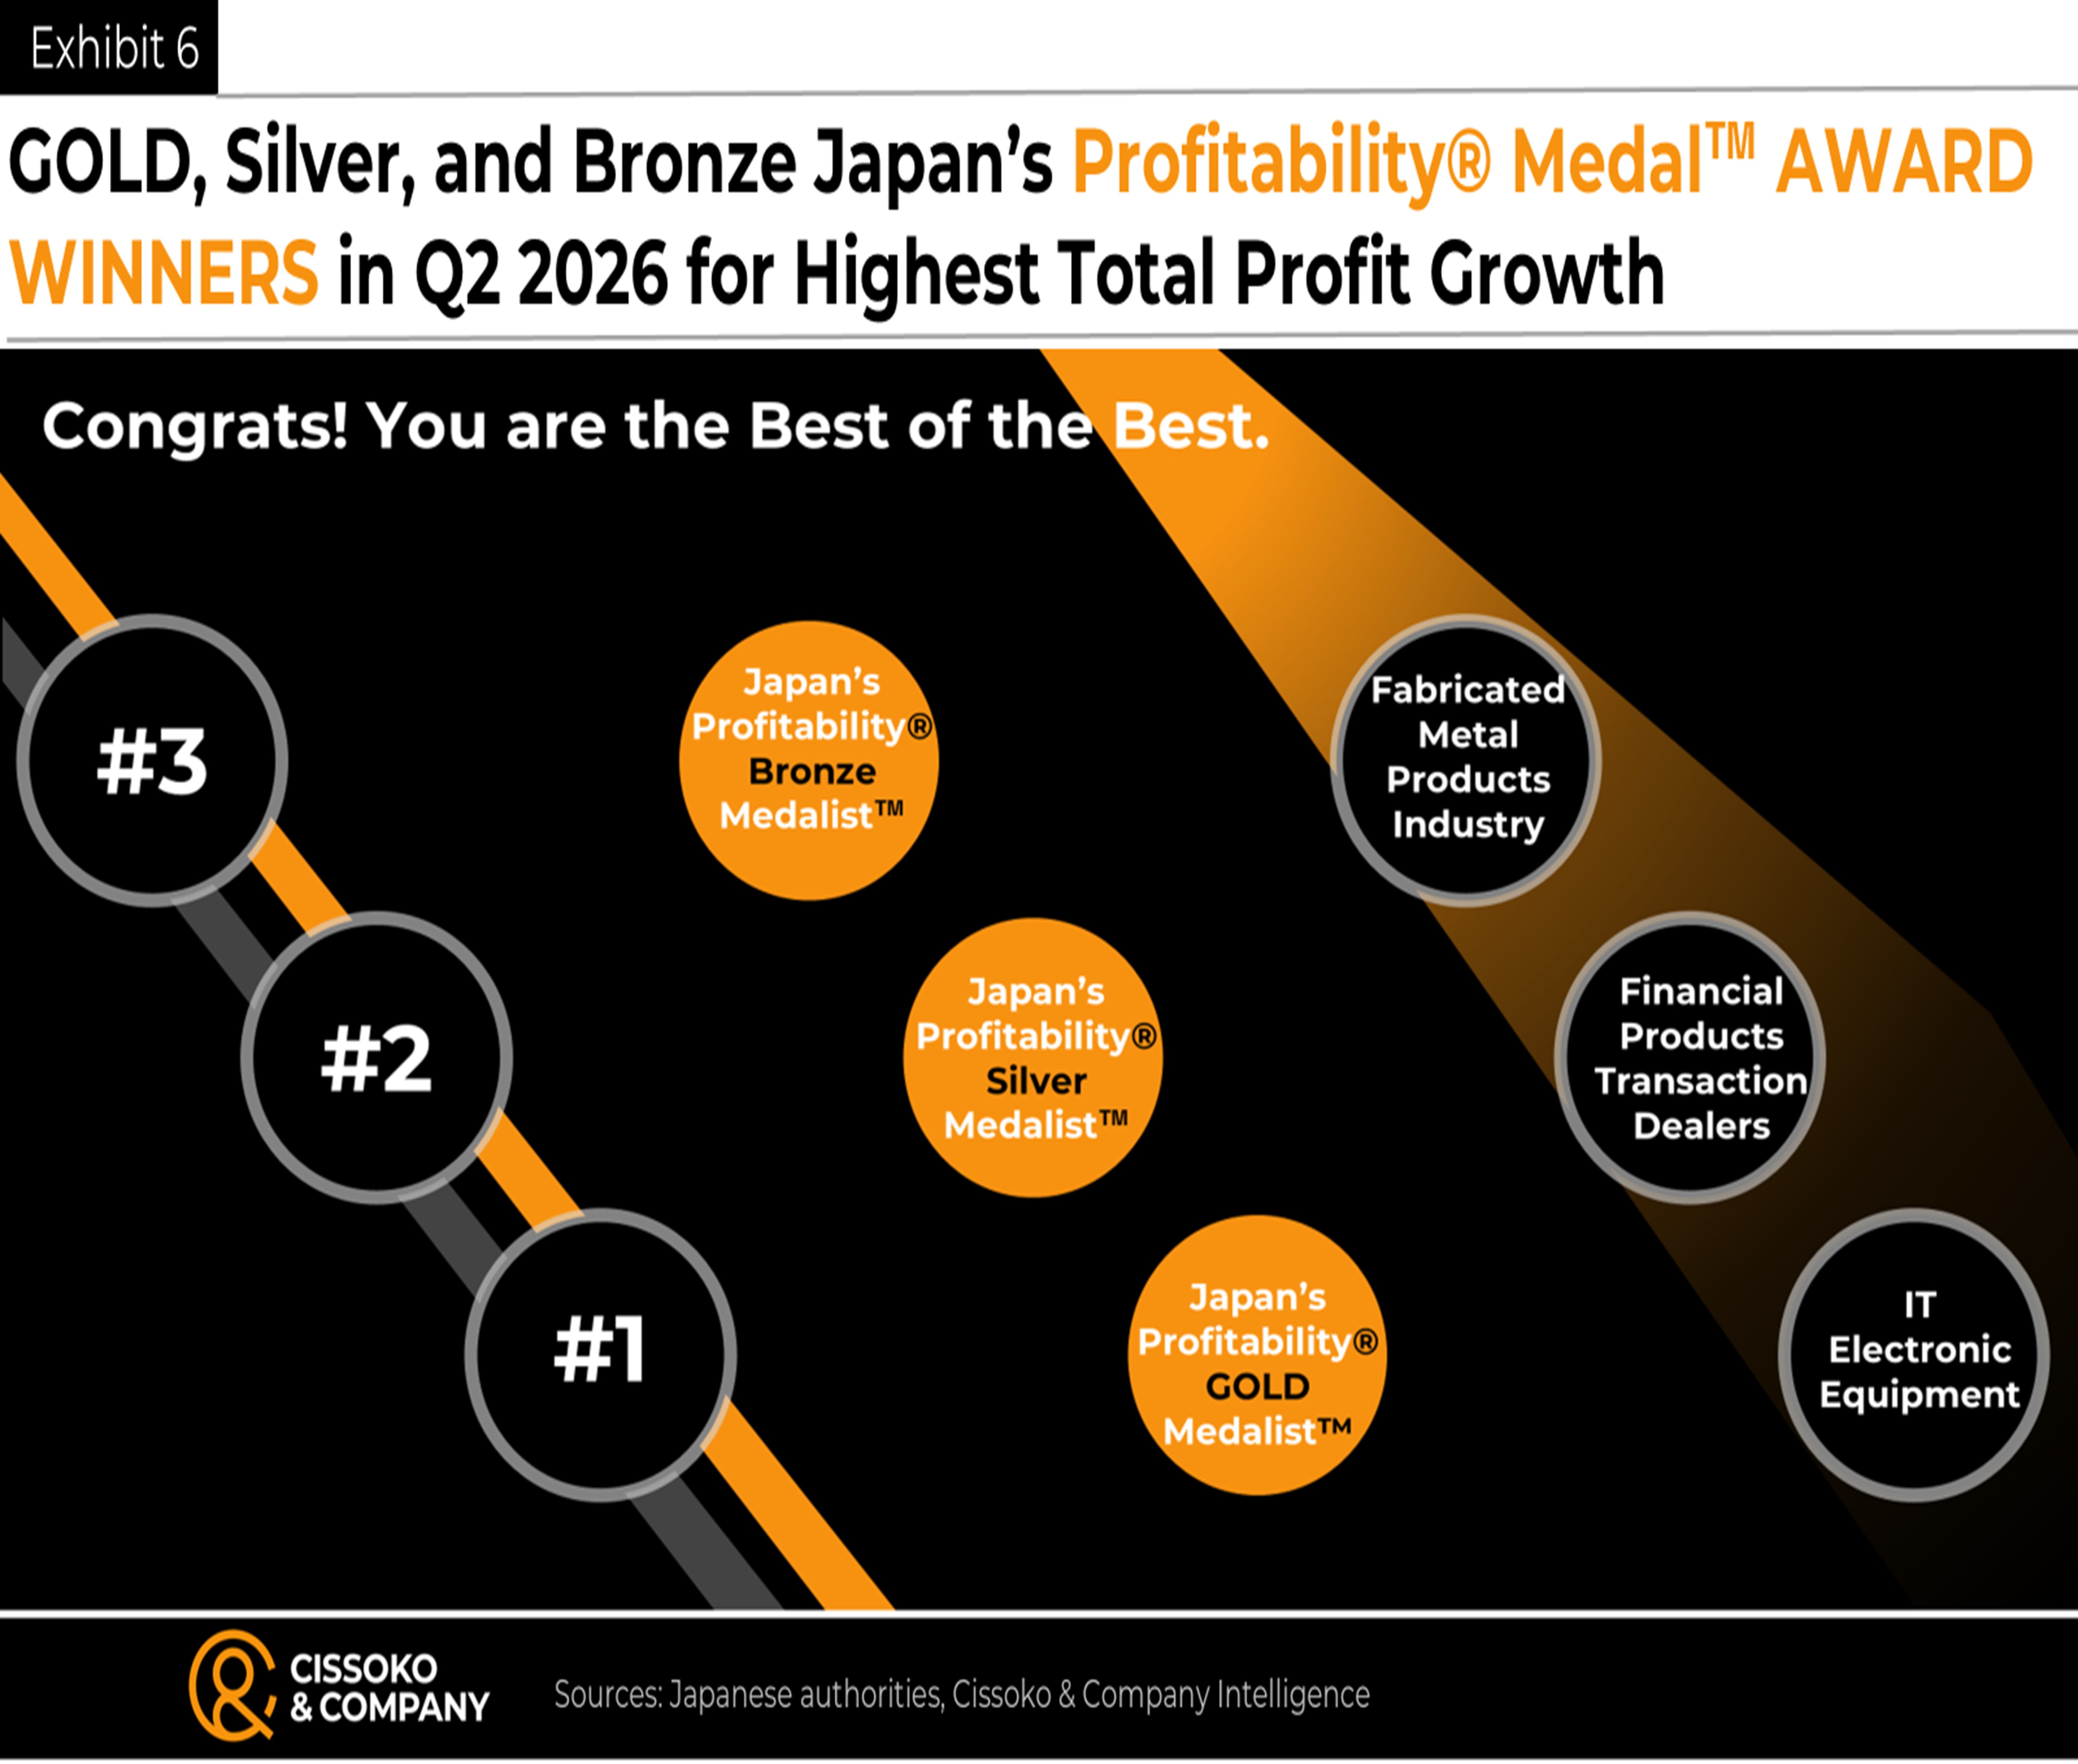
- Japan’s Profitability® GOLD Medalist™ for Q2 2026 is the information and communication (IT) electronic equipment industry. Total ordinary profit rose more than 170% year over year to ¥3 trillion. The AI boom fueled this growth, driving global demand for electronic and semiconductor inputs for technology and AI infrastructure, including data centers.
- Japan’s Profitability® Silver Medalist™ for Q2 2026 is awarded to financial products and transaction dealers. This segment increased total ordinary profit by 143% in Q2 2026 versus Q2 2025.
- Japan’s Profitability® Bronze™ Medalist for Q2 2026 is the fabricated metal products industry, which expanded total ordinary profit by 87% in April–June 2026 versus the prior-year period. The industry converts raw and intermediate metal sheets, bars, tubes, and ingots into structural parts and components of finished goods, including architectural and structural metals, tanks, boilers, containers, automotive body panels, and aerospace parts.
Japan’s Profitability Alpha®, Driver®, and KING® Medalists™ for Q2 2026
Not all of Japan’s Profitability® Medalists™ are equal. Thus far, we have assessed them by profit growth rate. That lens alone does not capture the competitive landscape: beyond growth rate, an industry’s share of Japan’s total profit growth in the second quarter of 2026, relative to the prior-year period, is equally material.
Which industries merit recognition through the profit contribution lens? First, a reminder of the scale of total ordinary profit growth: ¥10.5 trillion. Excluding the two sectors (manufacturing and combined finance and insurance) designated Japan’s Profitability® Medalists™ in Q2 of this year, the median profit contribution of the other 11 industries meeting the Q2 2026 threshold was ¥418 billion.
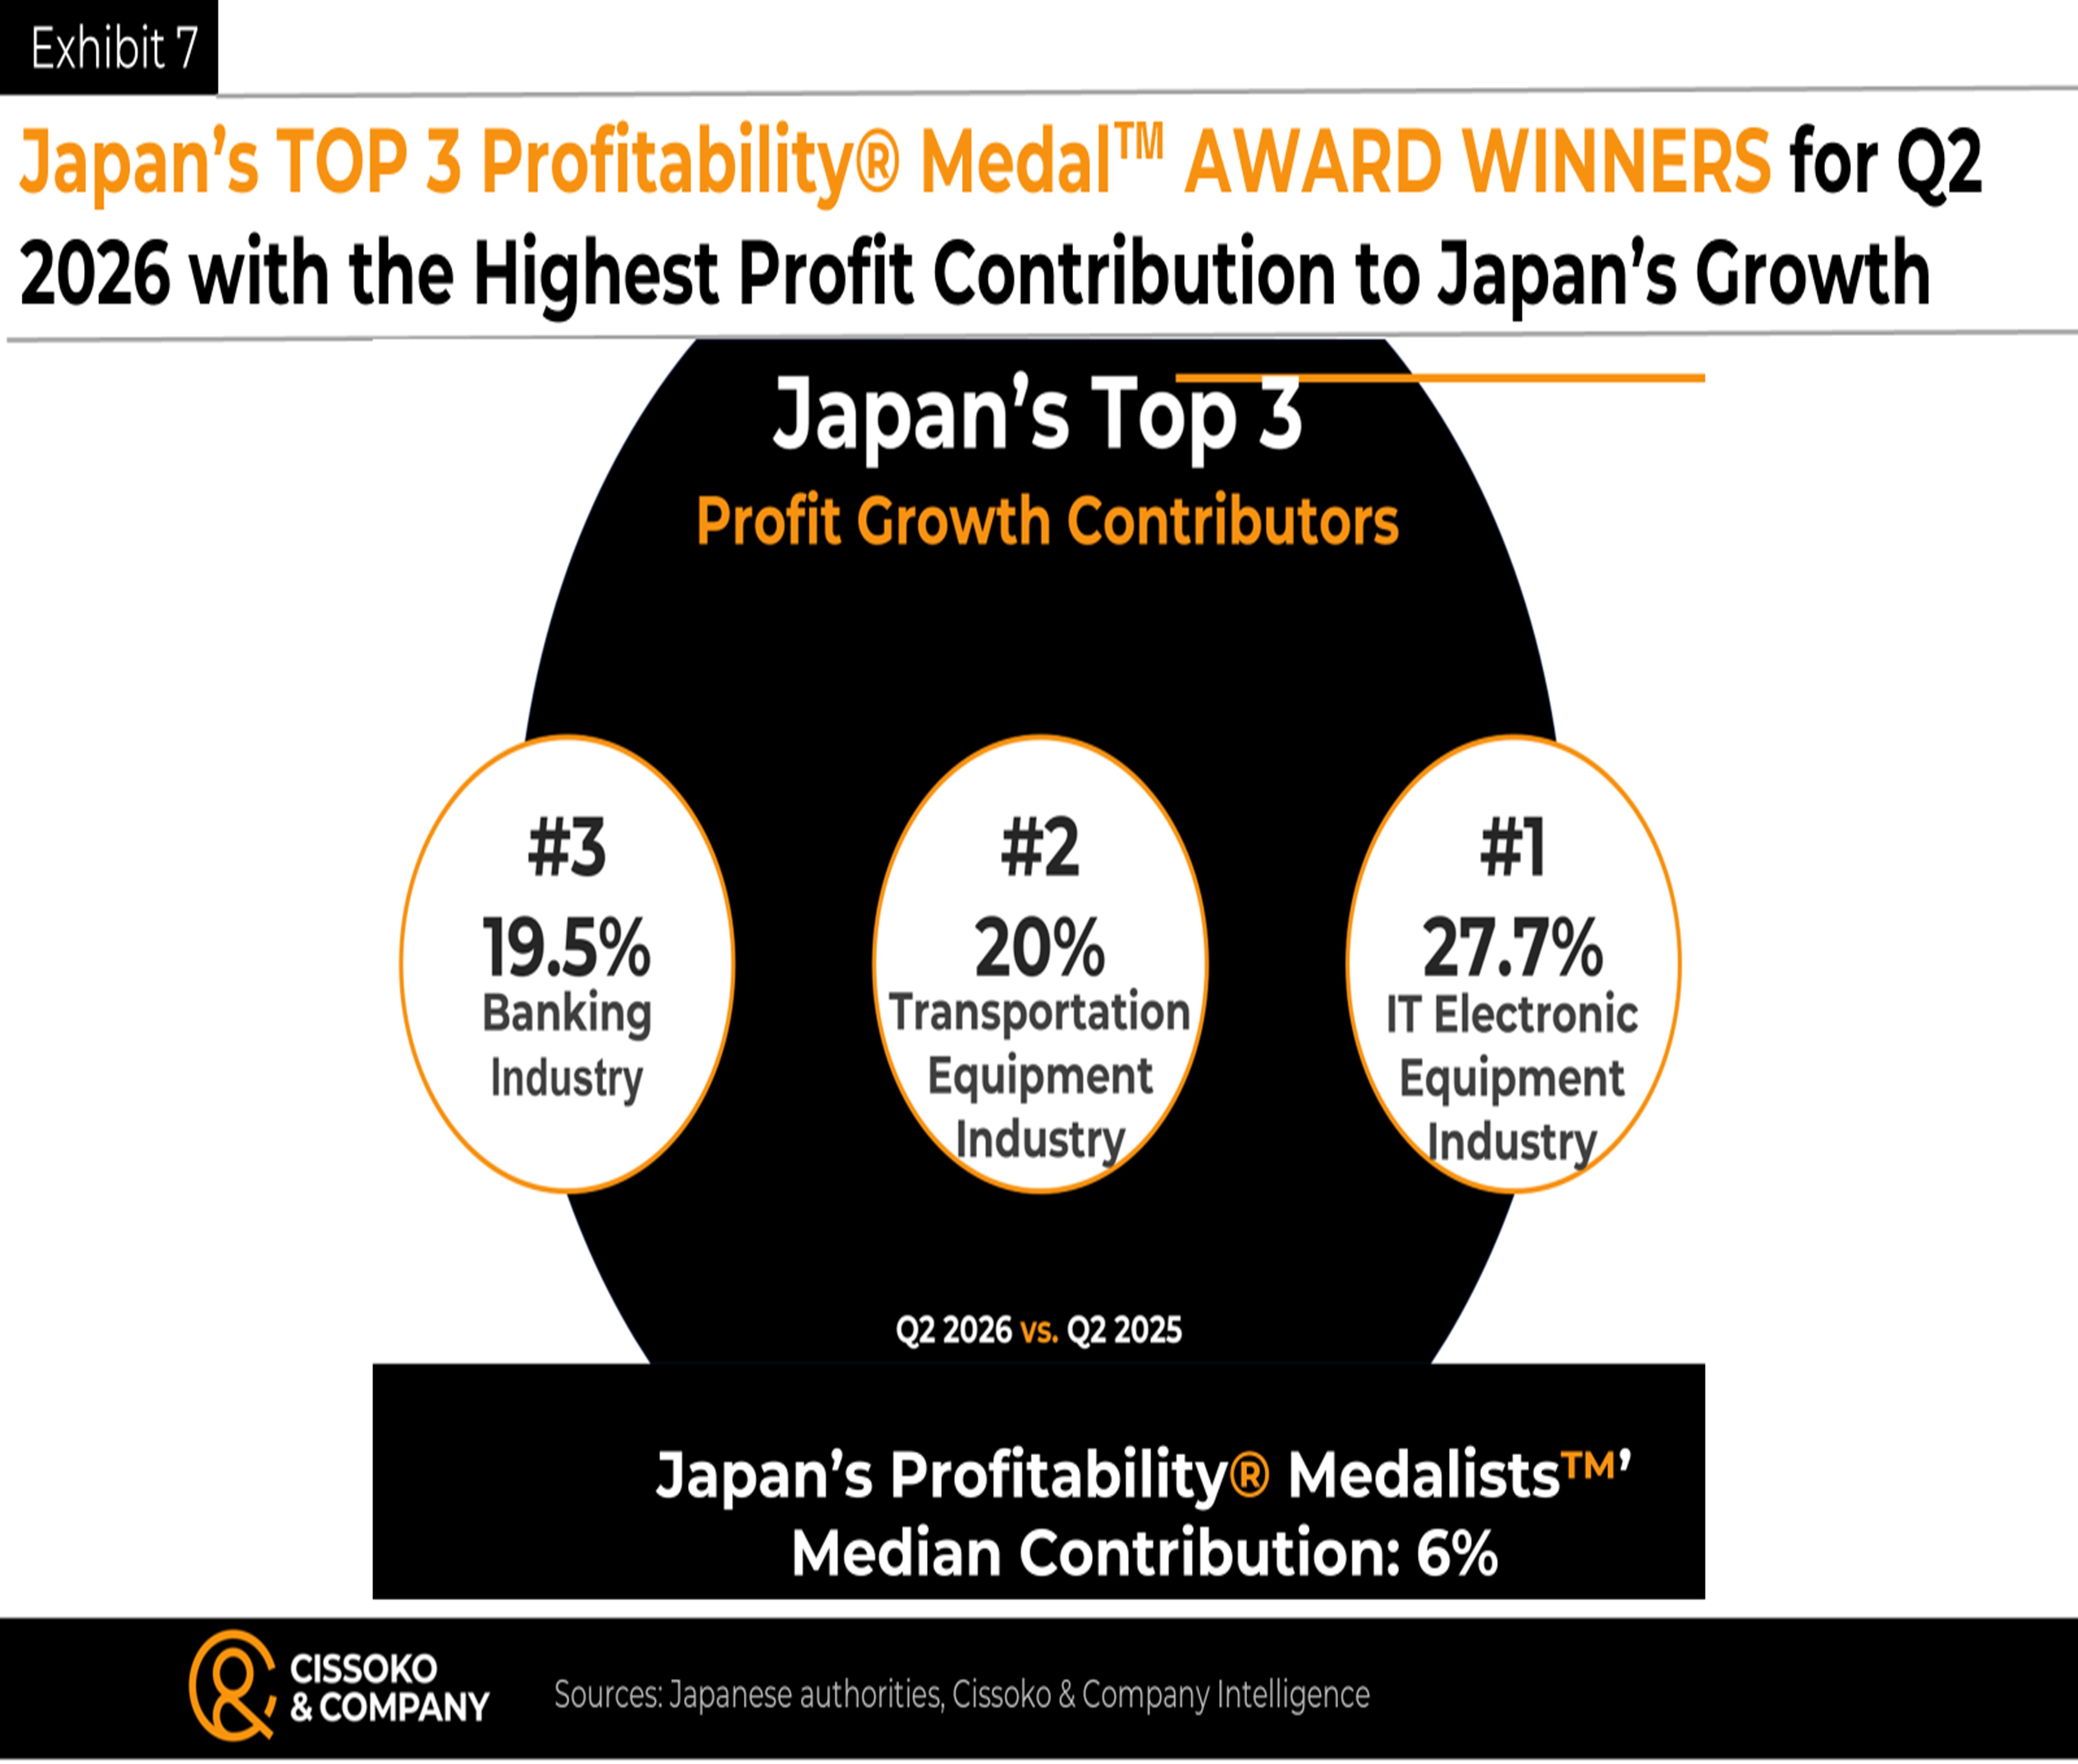
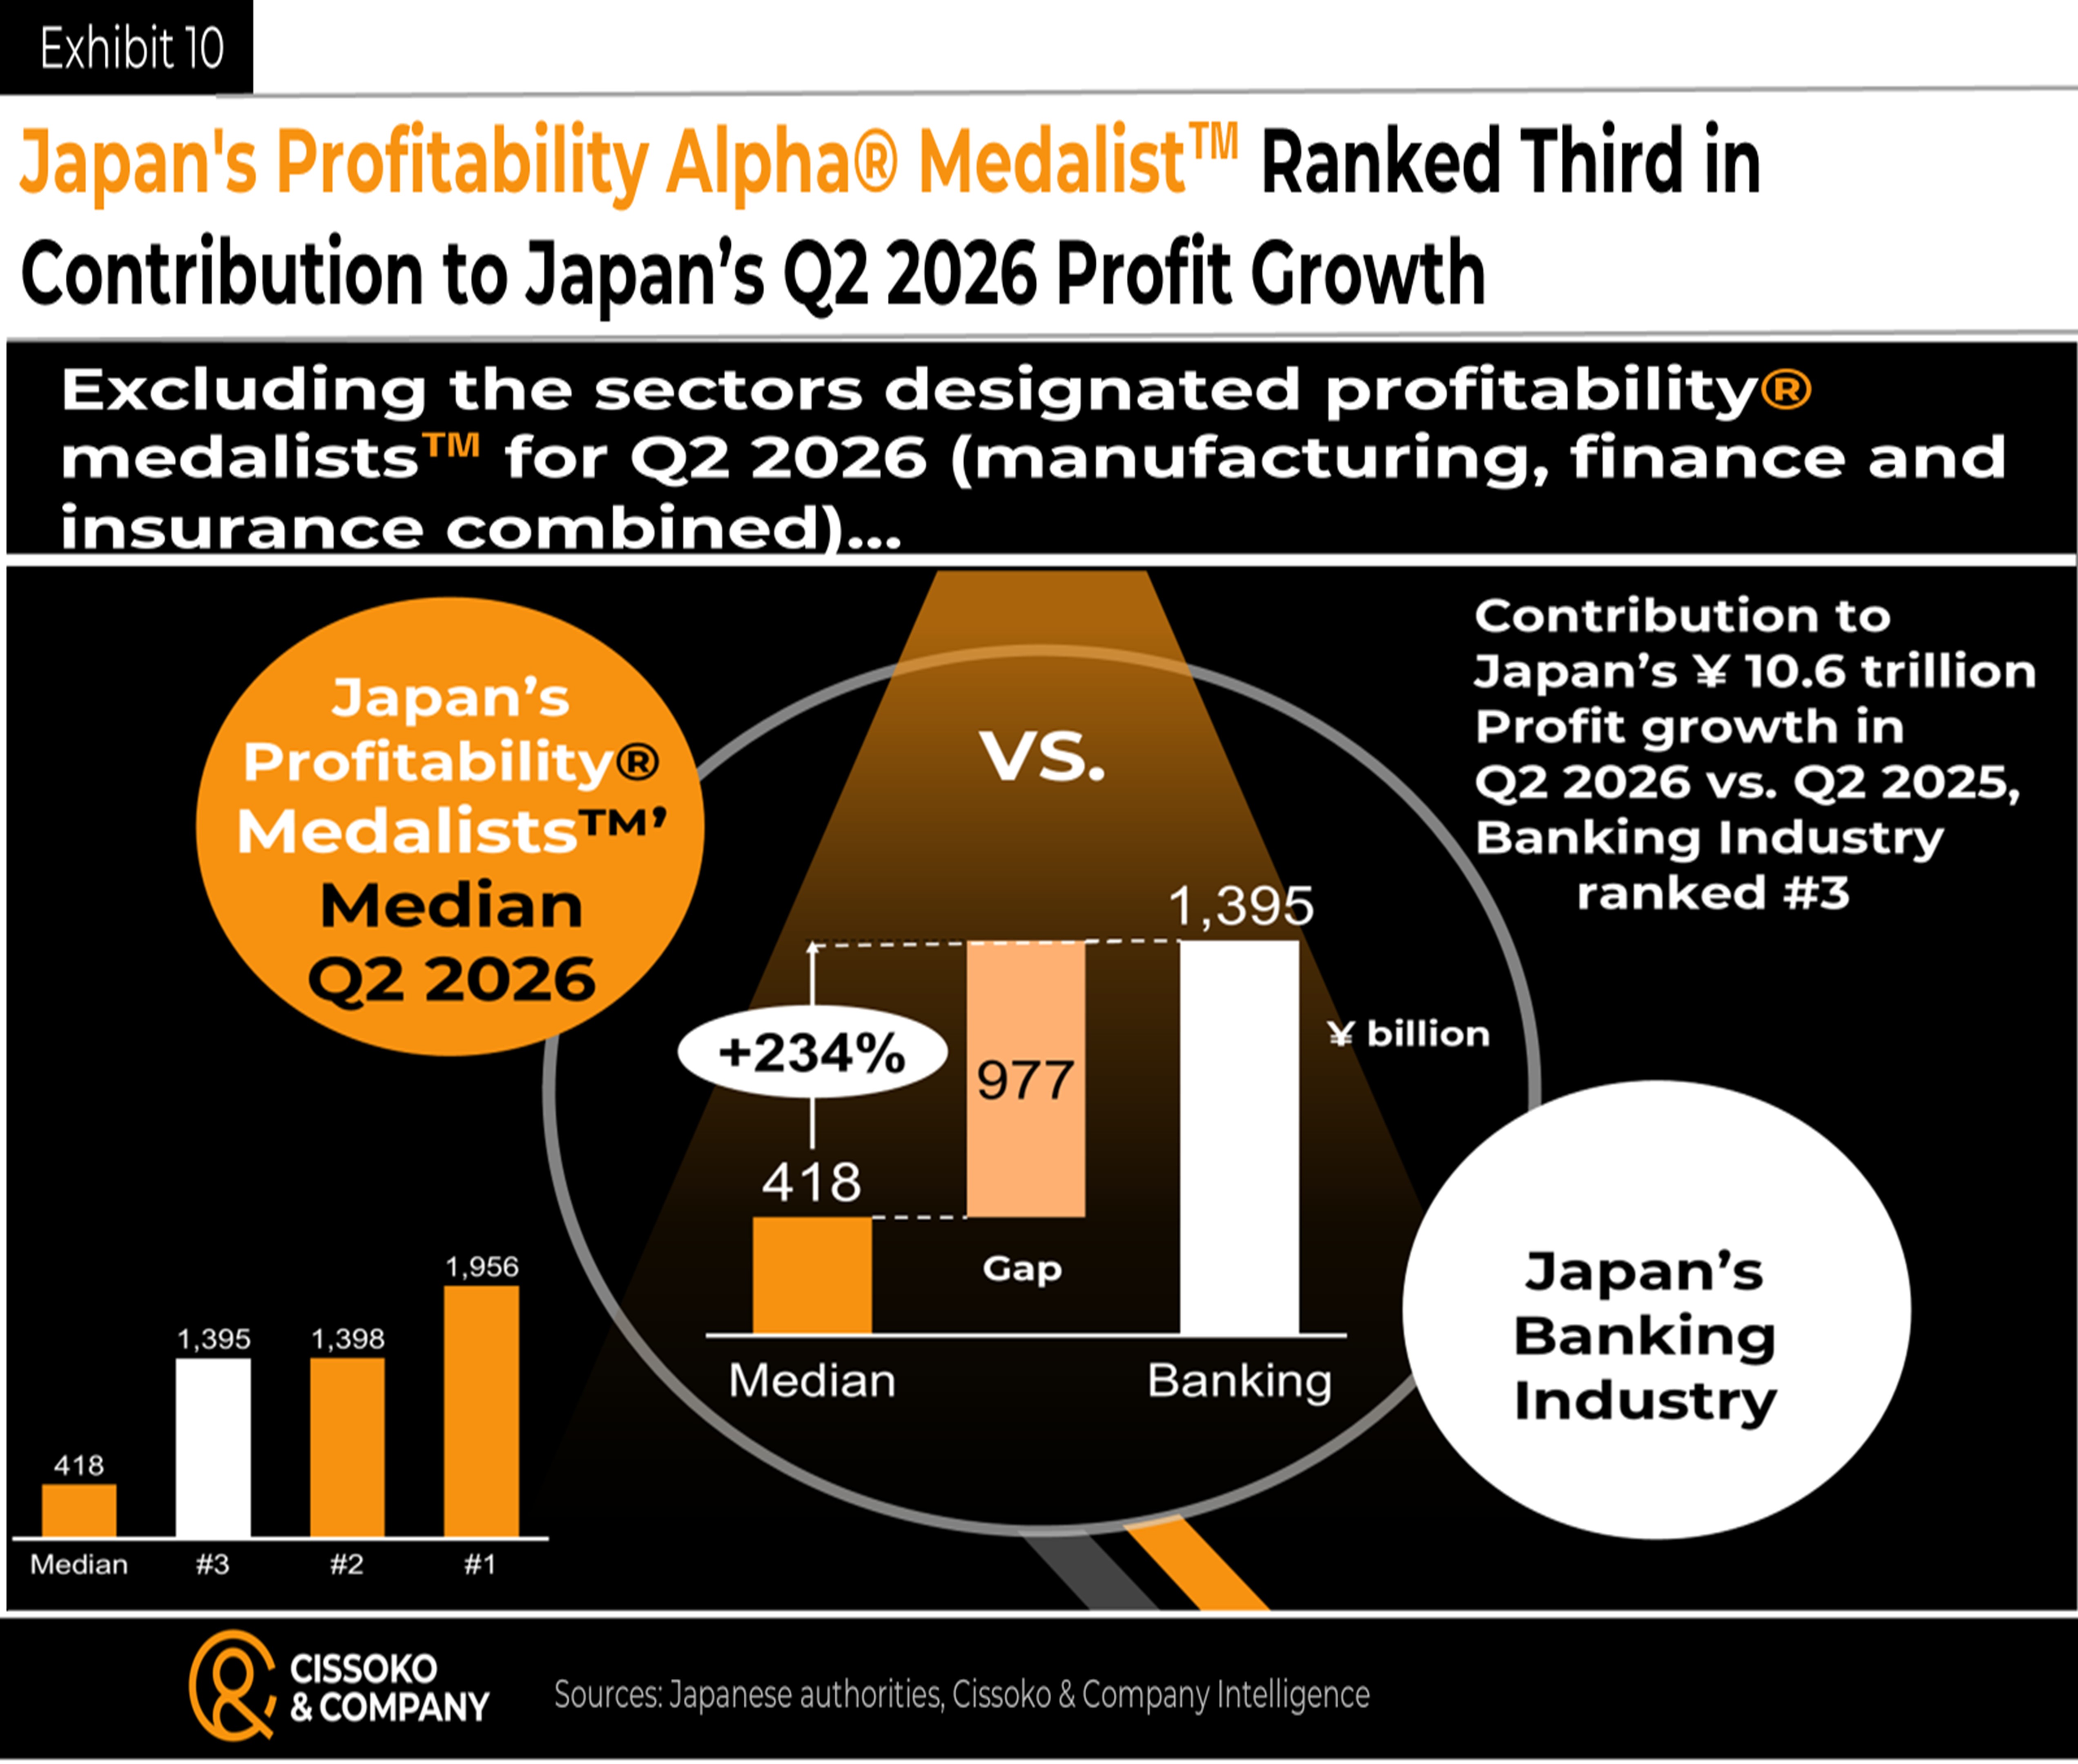
Only six industries contributed at least ¥418 billion to Japan’s overall profit growth over the period, including information and communications equipment (¥1,956B), transportation equipment (¥1,398B), and banking (¥1,395B). These three industries earned our awards as follows:
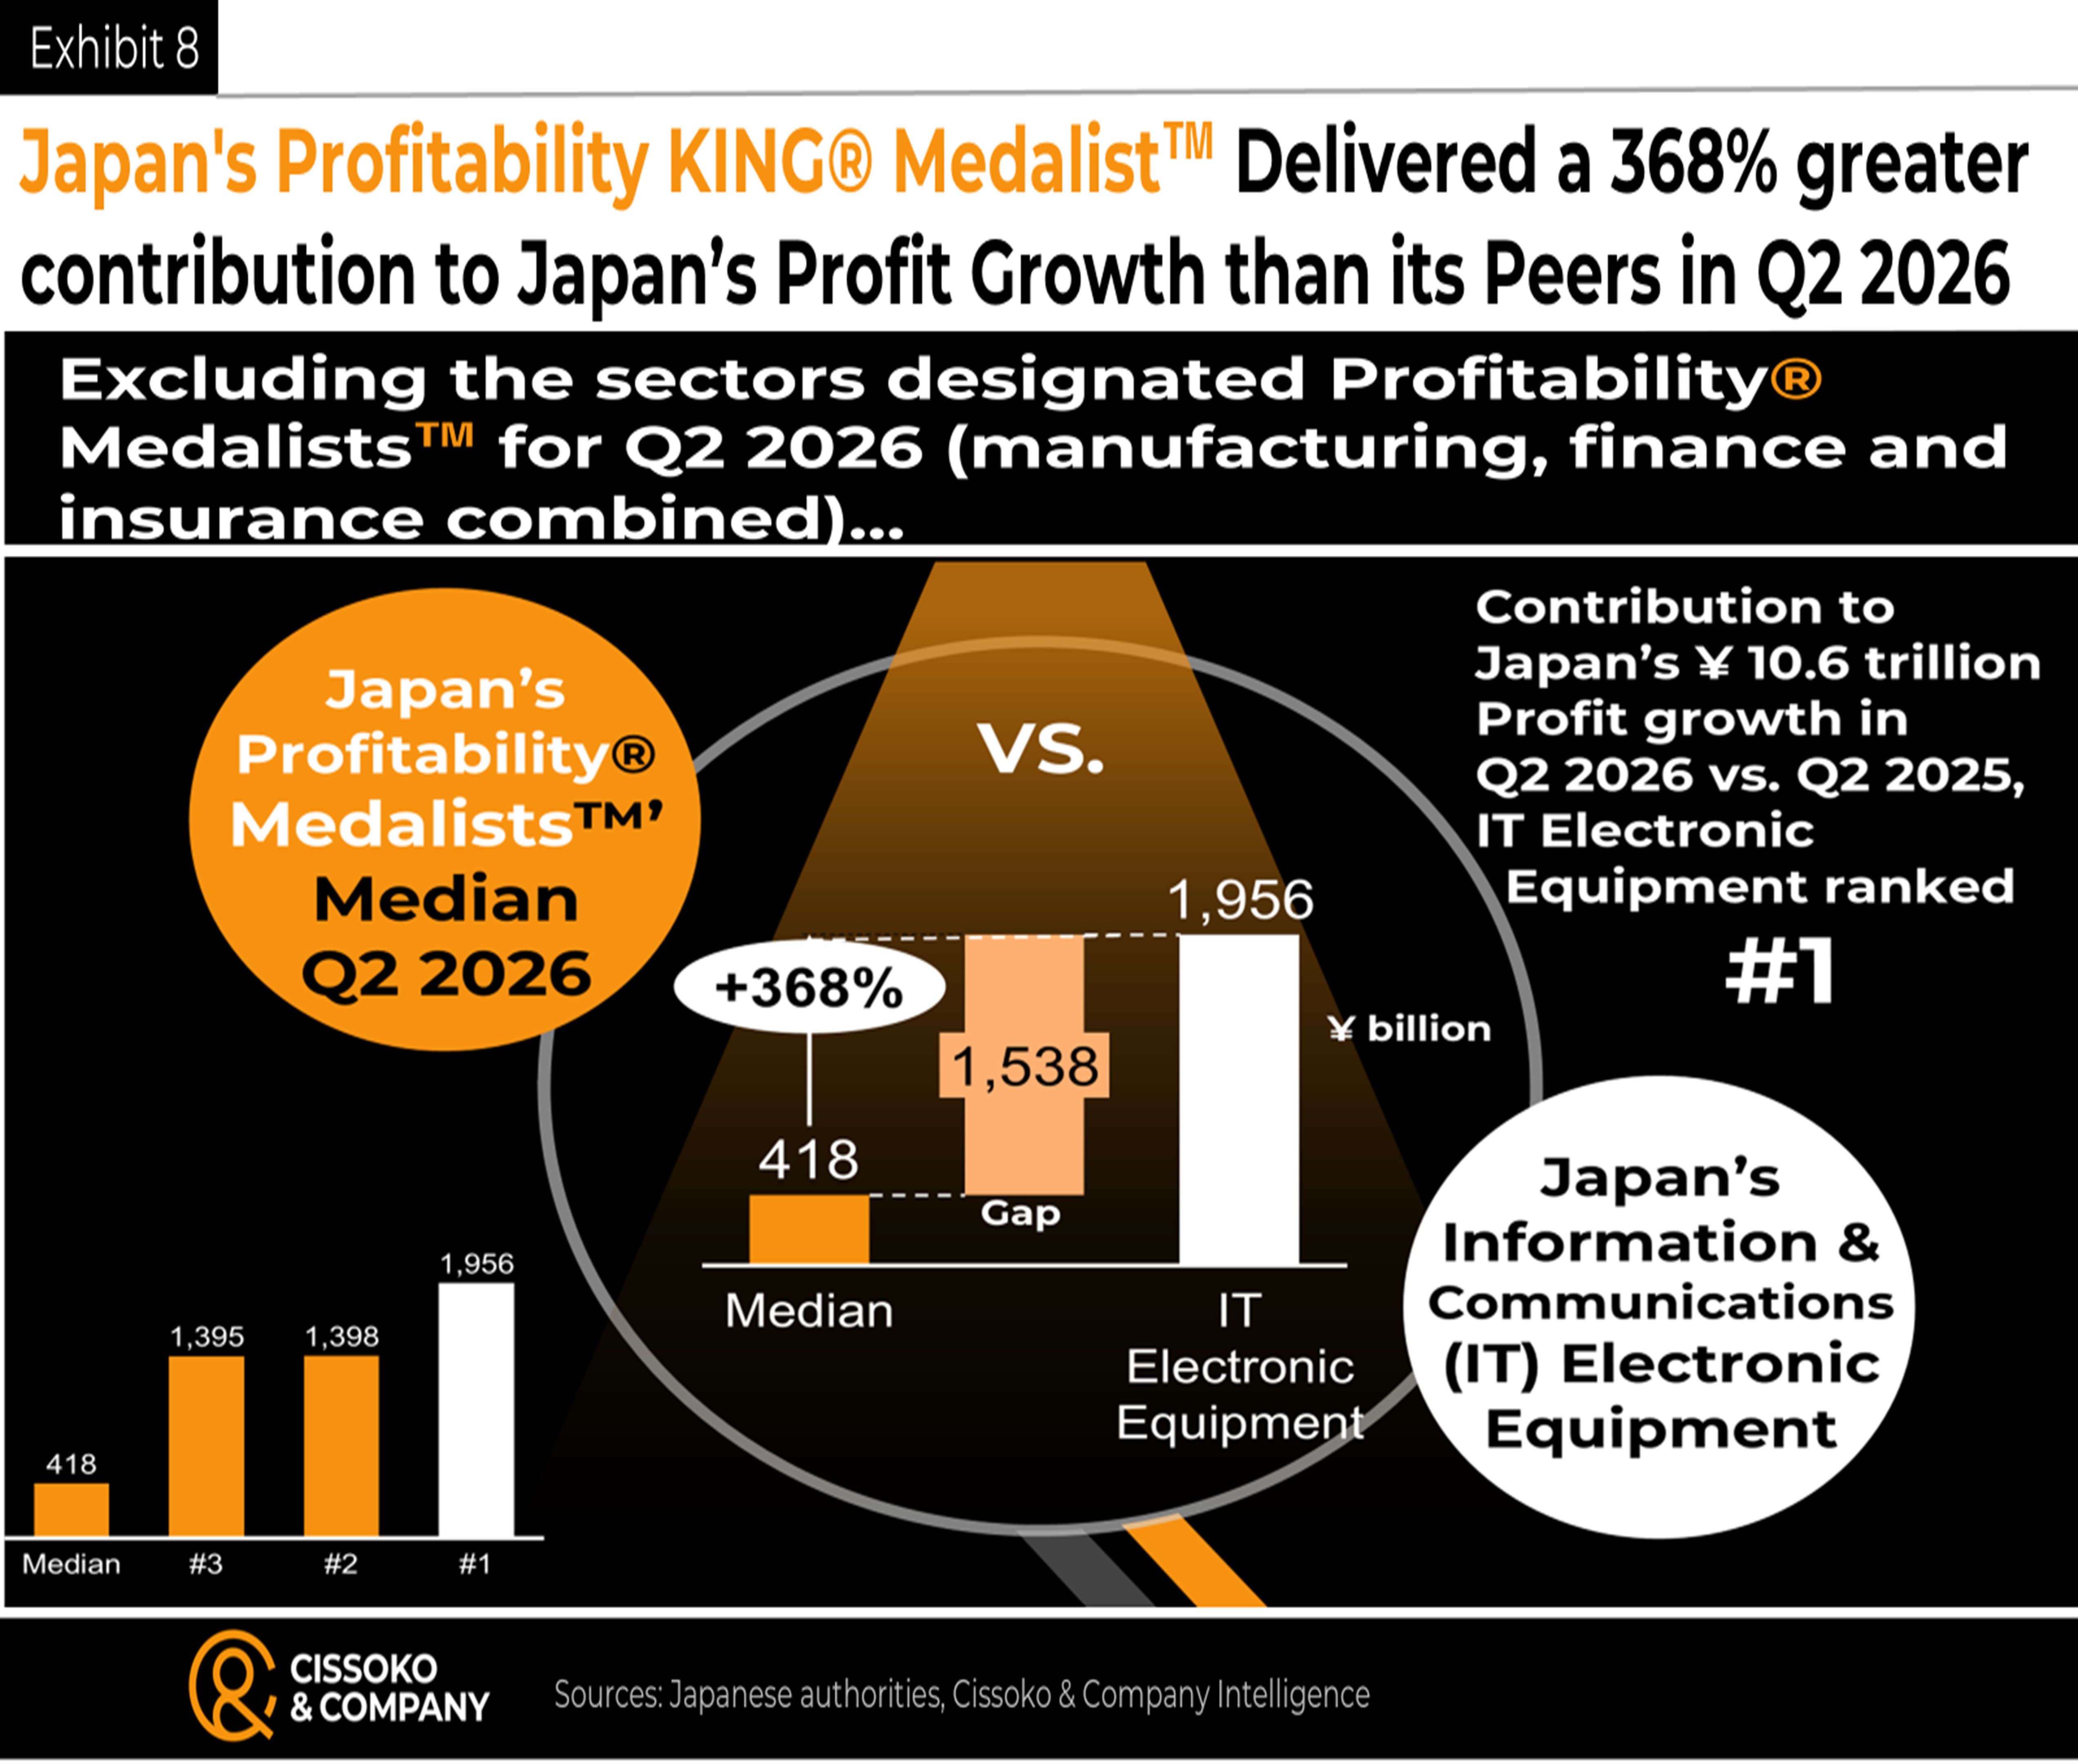
Japan’s profitability KING® Medalist™ for Q2 2026 was awarded to the information and communications (IT) electronic equipment industry for its leading 26% share of profit growth, 368% above the median contribution.
Japan’s profitability Driver® Medalist™ for Q2 2026 was awarded to Japan’s transportation equipment industry as the second-largest contributor (19%) to national profit growth. Its contribution was 234% above the median (\418B) of its 11 medalist peer industries.
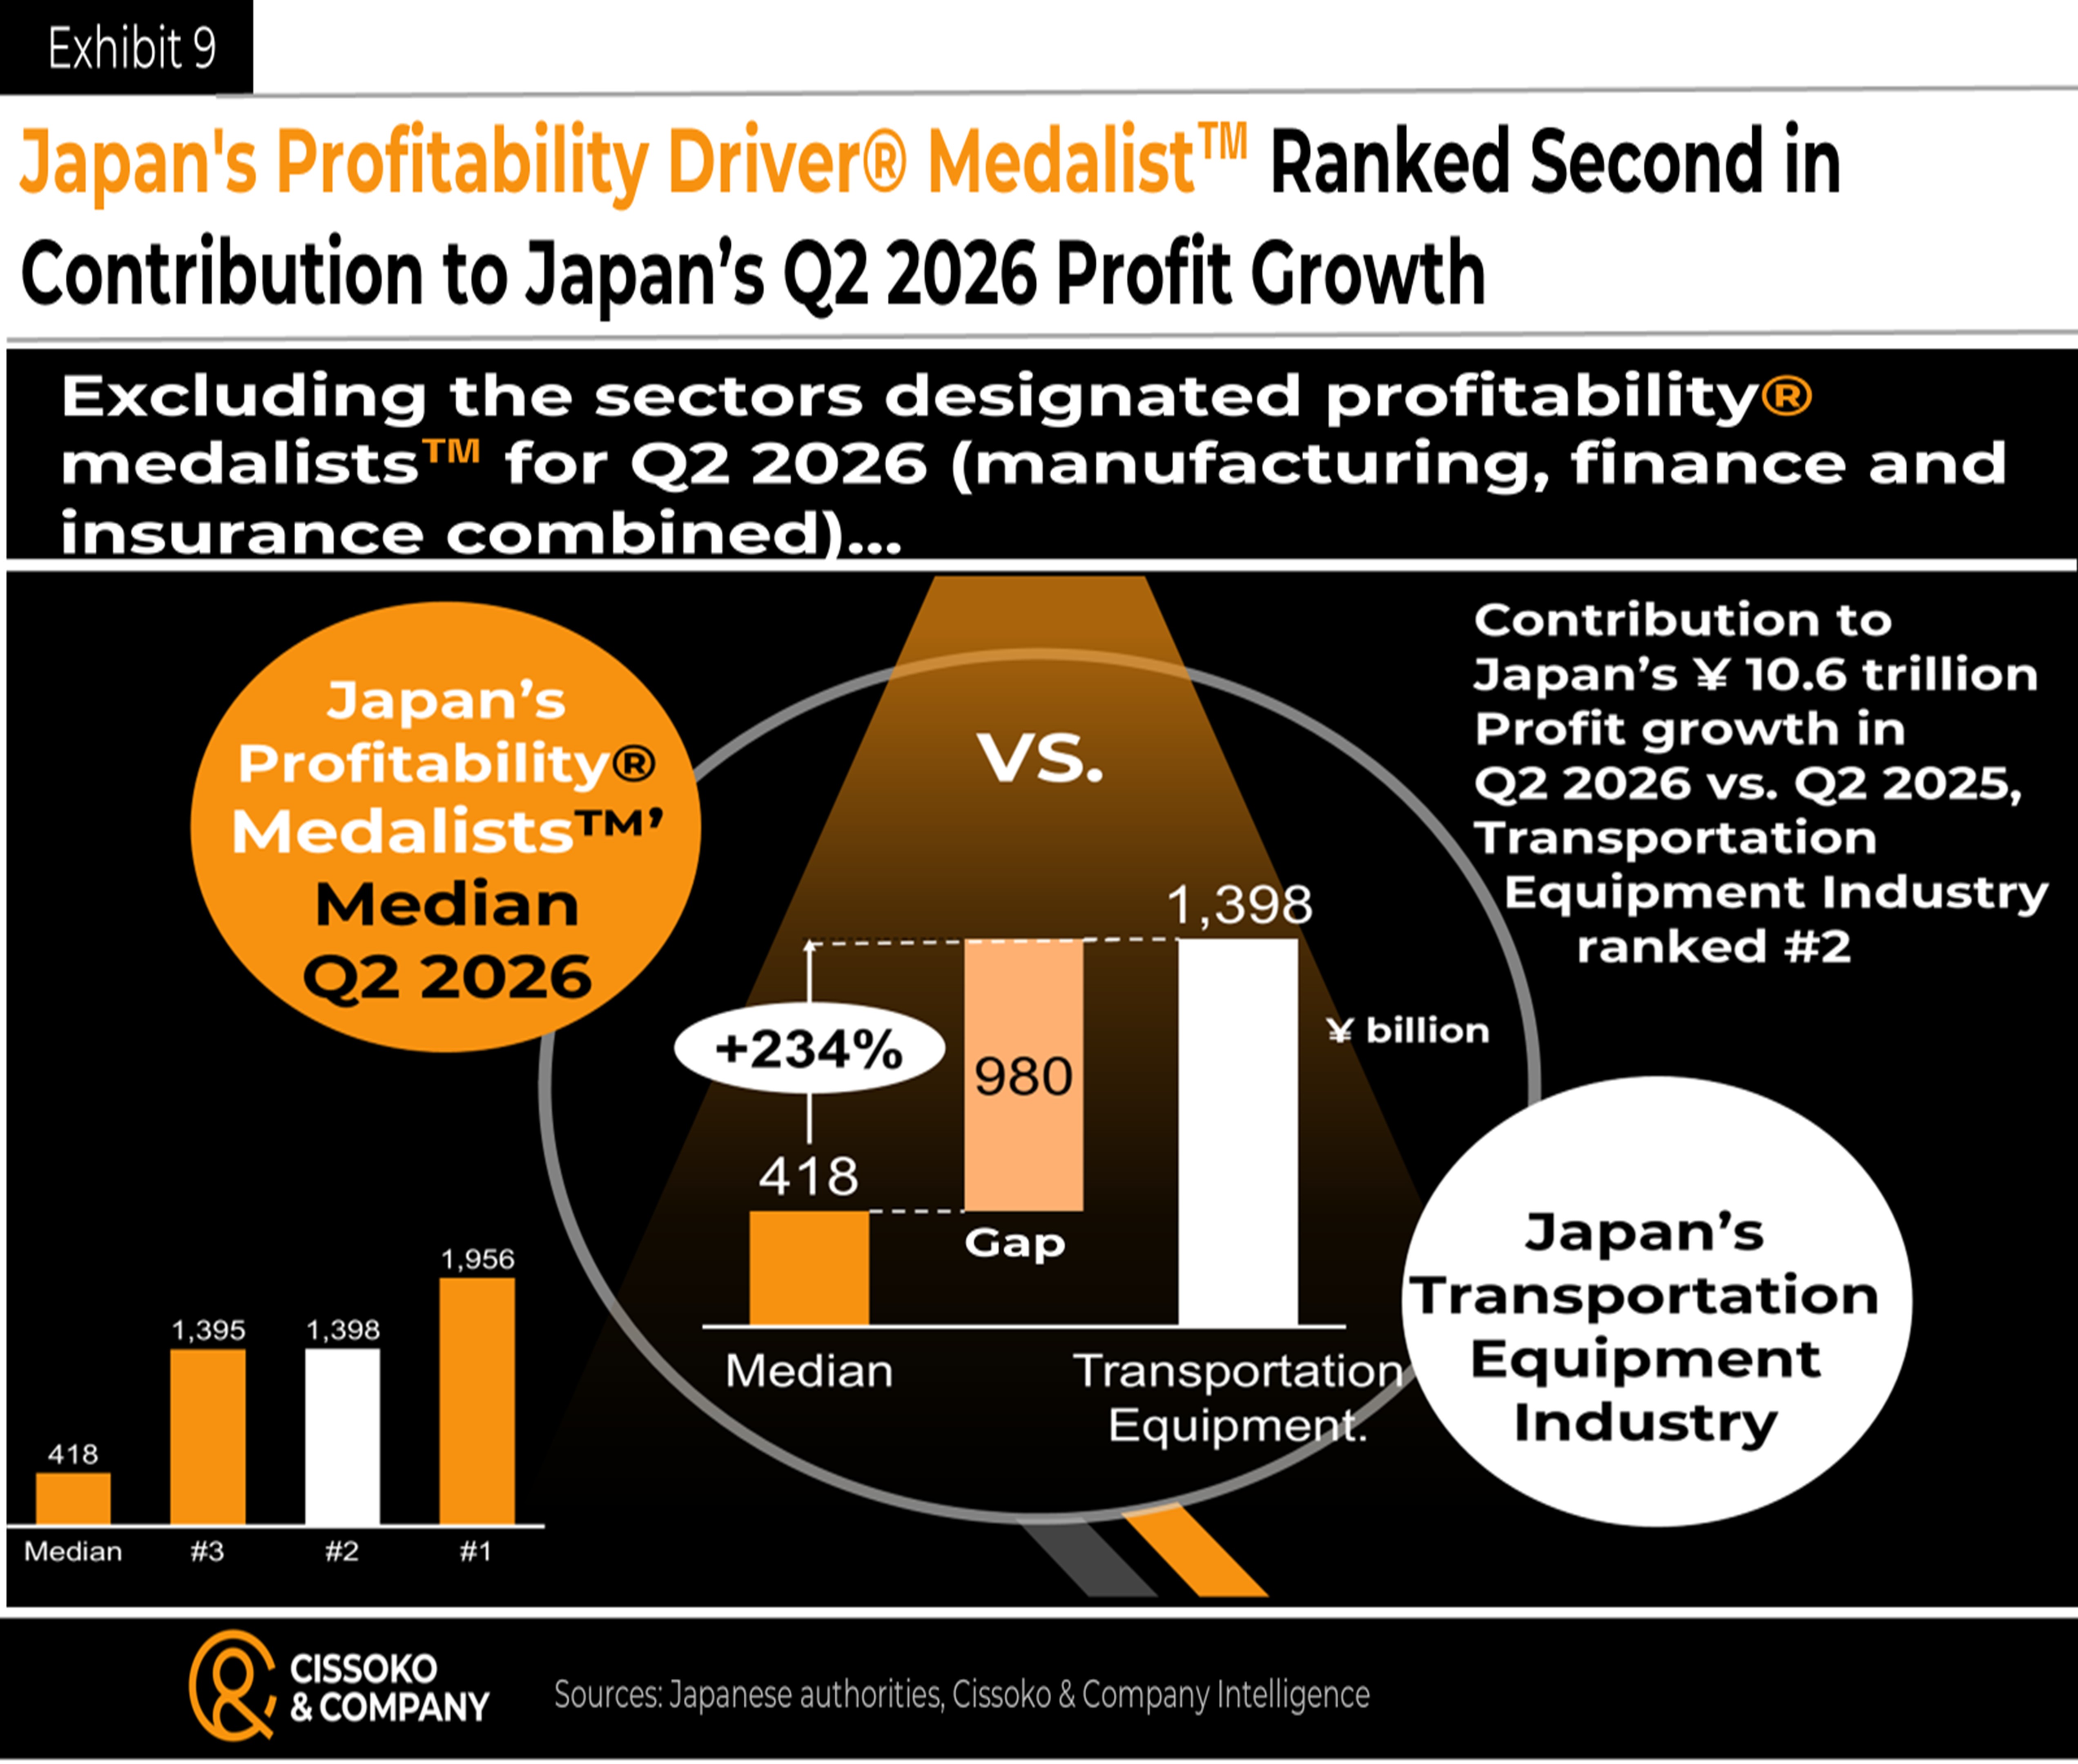
Japan’s profitability Alpha® Medalist™ for Q2 2026 was awarded to Japan’s banking industry, whose 18% contribution ranked third, just behind transportation equipment. Like that industry, banking contributed 234% above the median of the 11 industries designated as Japan’s profitability® Medalist™ in the second quarter of this year.
Once again, congratulations to Japan’s Profitability® Medalists™ for Q2 2026: earning our fact-based, prestigious awards is a significant achievement in the age of AI, amid wars, supply chain constraints, and global economic disruption. Above all, winners must not rest on past success: complacency breeds blindness in an era of rapid technological innovation and intense productivity competition.
Japan’s Profitability® Medalists™ for Q1 2026 that Dropped from the Q2 List
Excluding the two major economic sectors (manufacturing industry as a whole and the combined finance and insurance sector) that our inaugural award winners belong to, six industries (40%) recognized in Q1 2026 no longer appear on our latest list of Japan’s Profitability® Medalists™ for Q2 2026. These include food, life insurance, non-life insurance, general-purpose machinery, production machinery and transport and postal services.
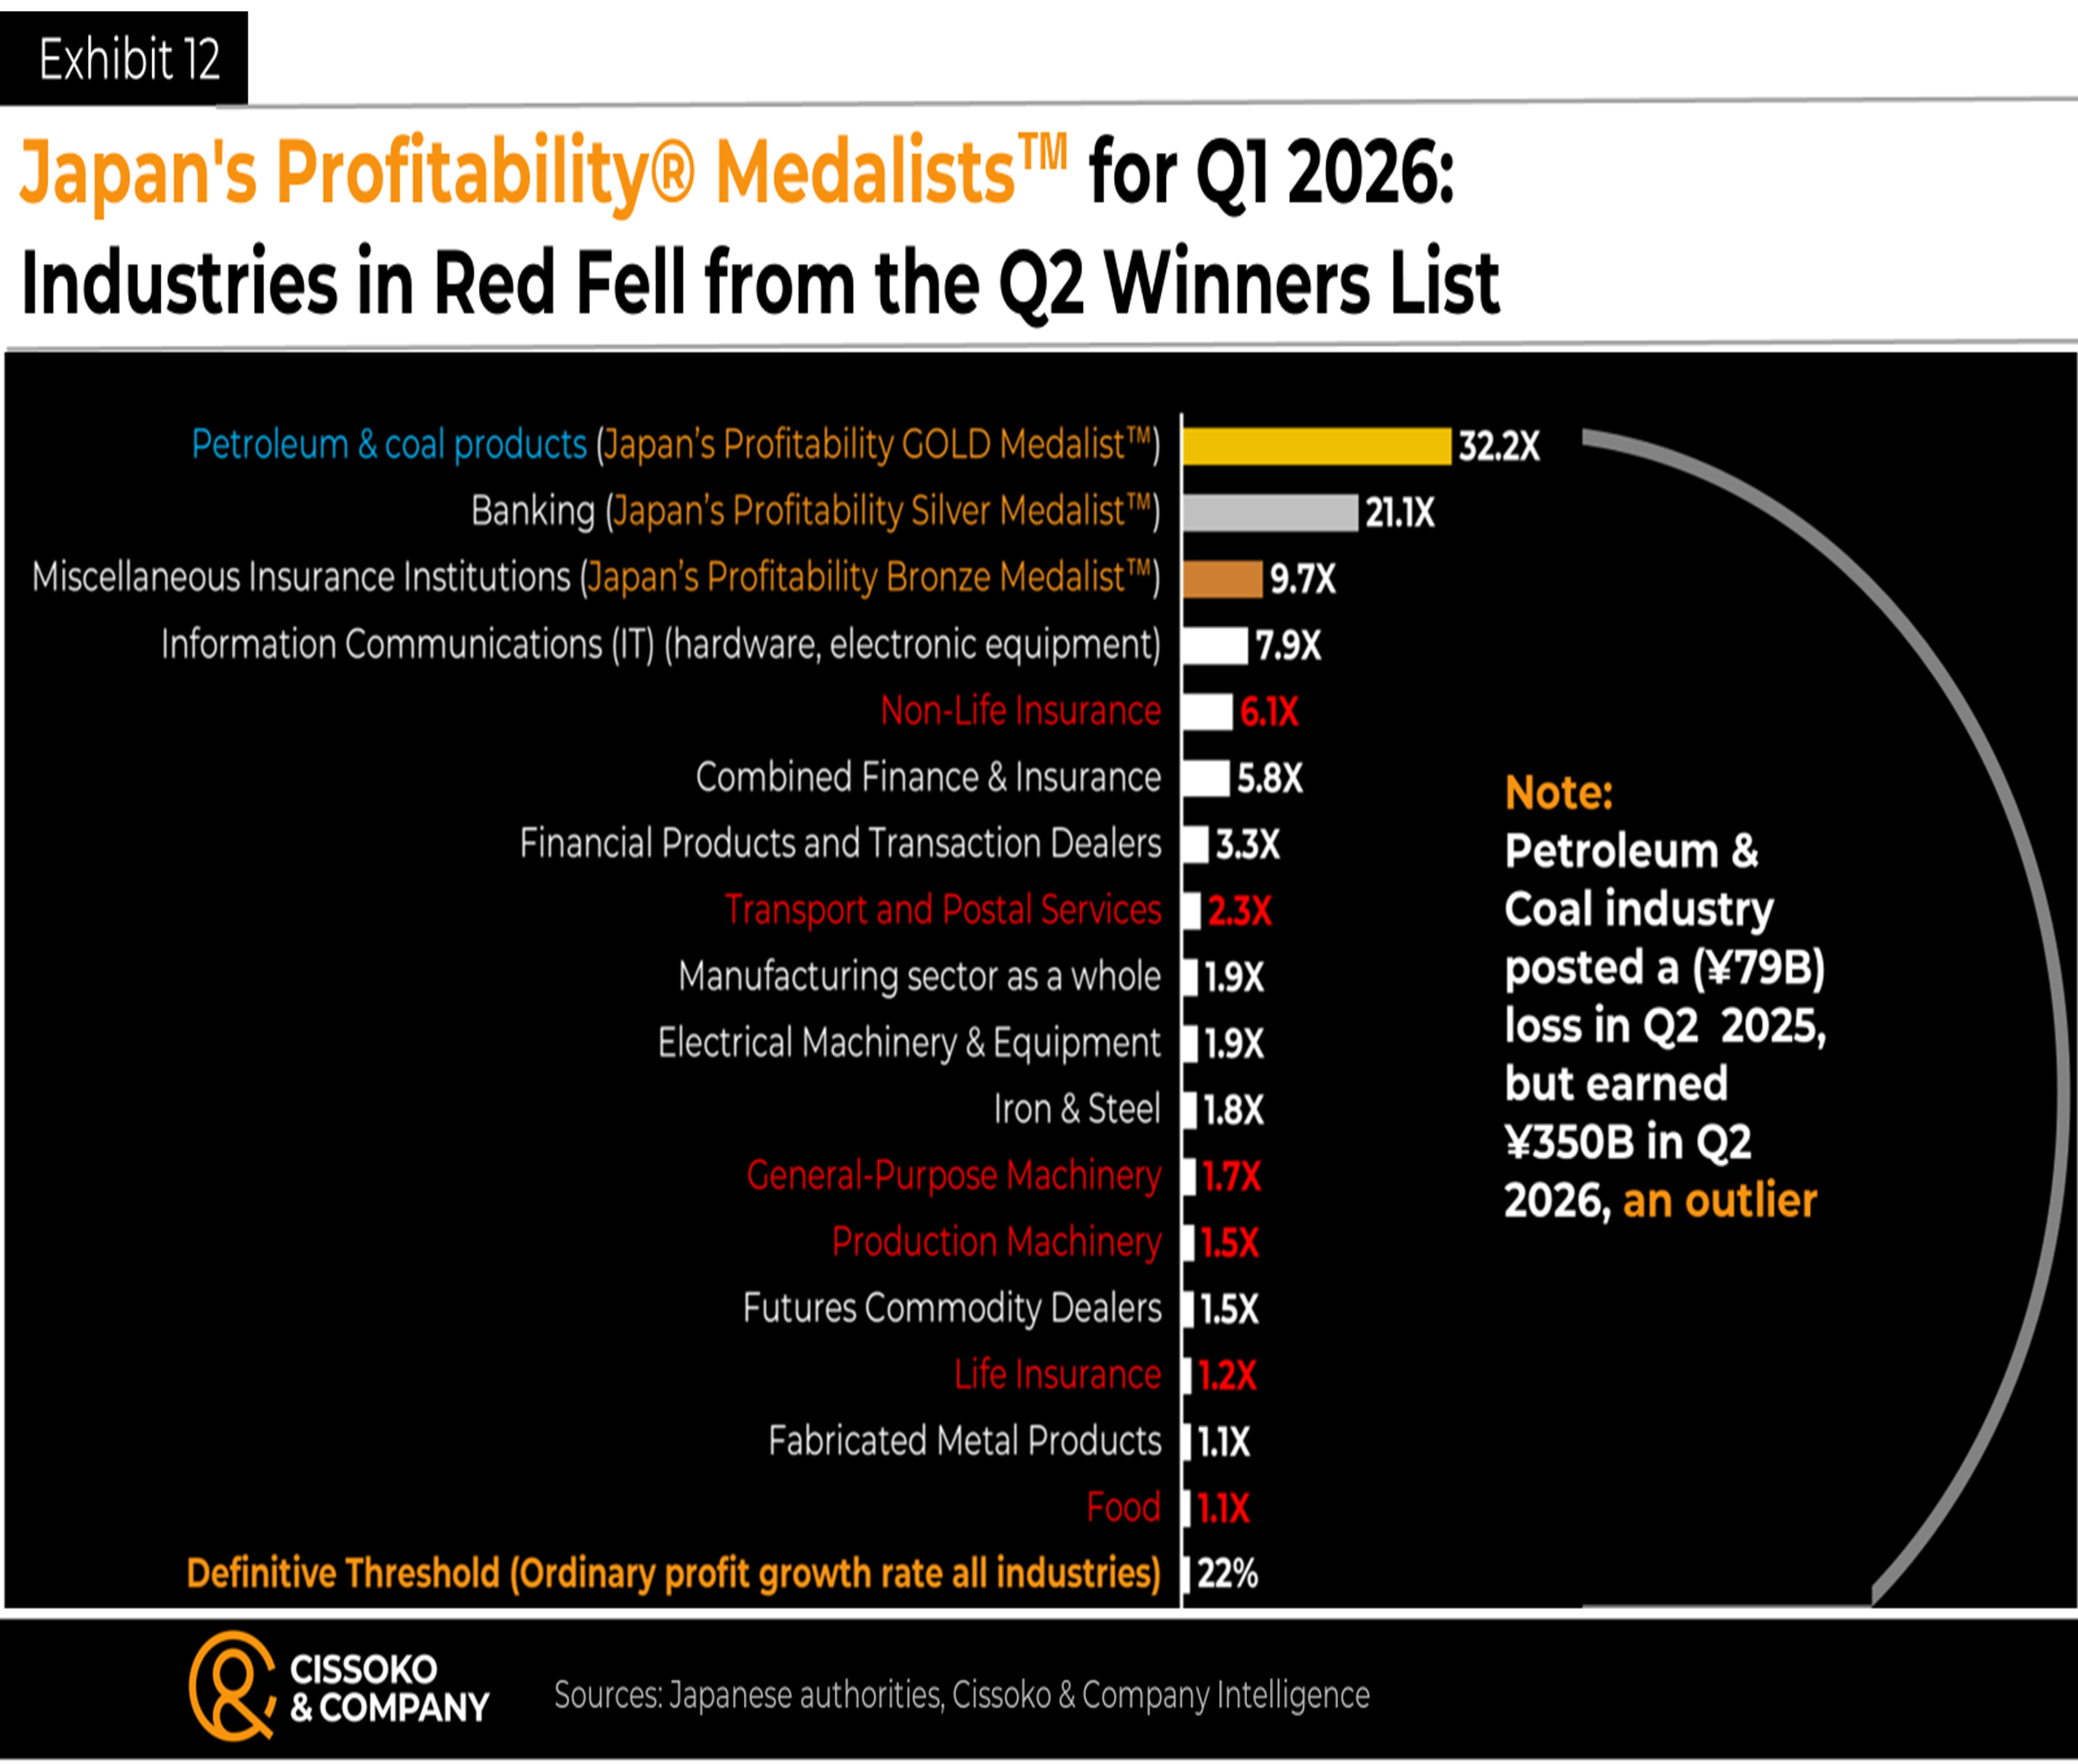
Furthermore, the petroleum and coal products industry — whose total profit surged more than 700% in Q1 2026 versus Q1 2025, securing its status as Japan’s Profitability® GOLD Medalist™ for that quarter — was excluded as an outlier. Specifically, the industry recorded losses of approximately ¥79 billion in Q2 2025, yet generated roughly ¥350 billion in the same period this year.
Concentration of Japan’s Profitability® Medalists™ for Q2 2026
Our analysis shows that across Japan’s three major economic sectors (manufacturing, non-manufacturing, finance and insurance), Japan Profitability® Award™ winners were concentrated predominantly in manufacturing, followed by finance and insurance.
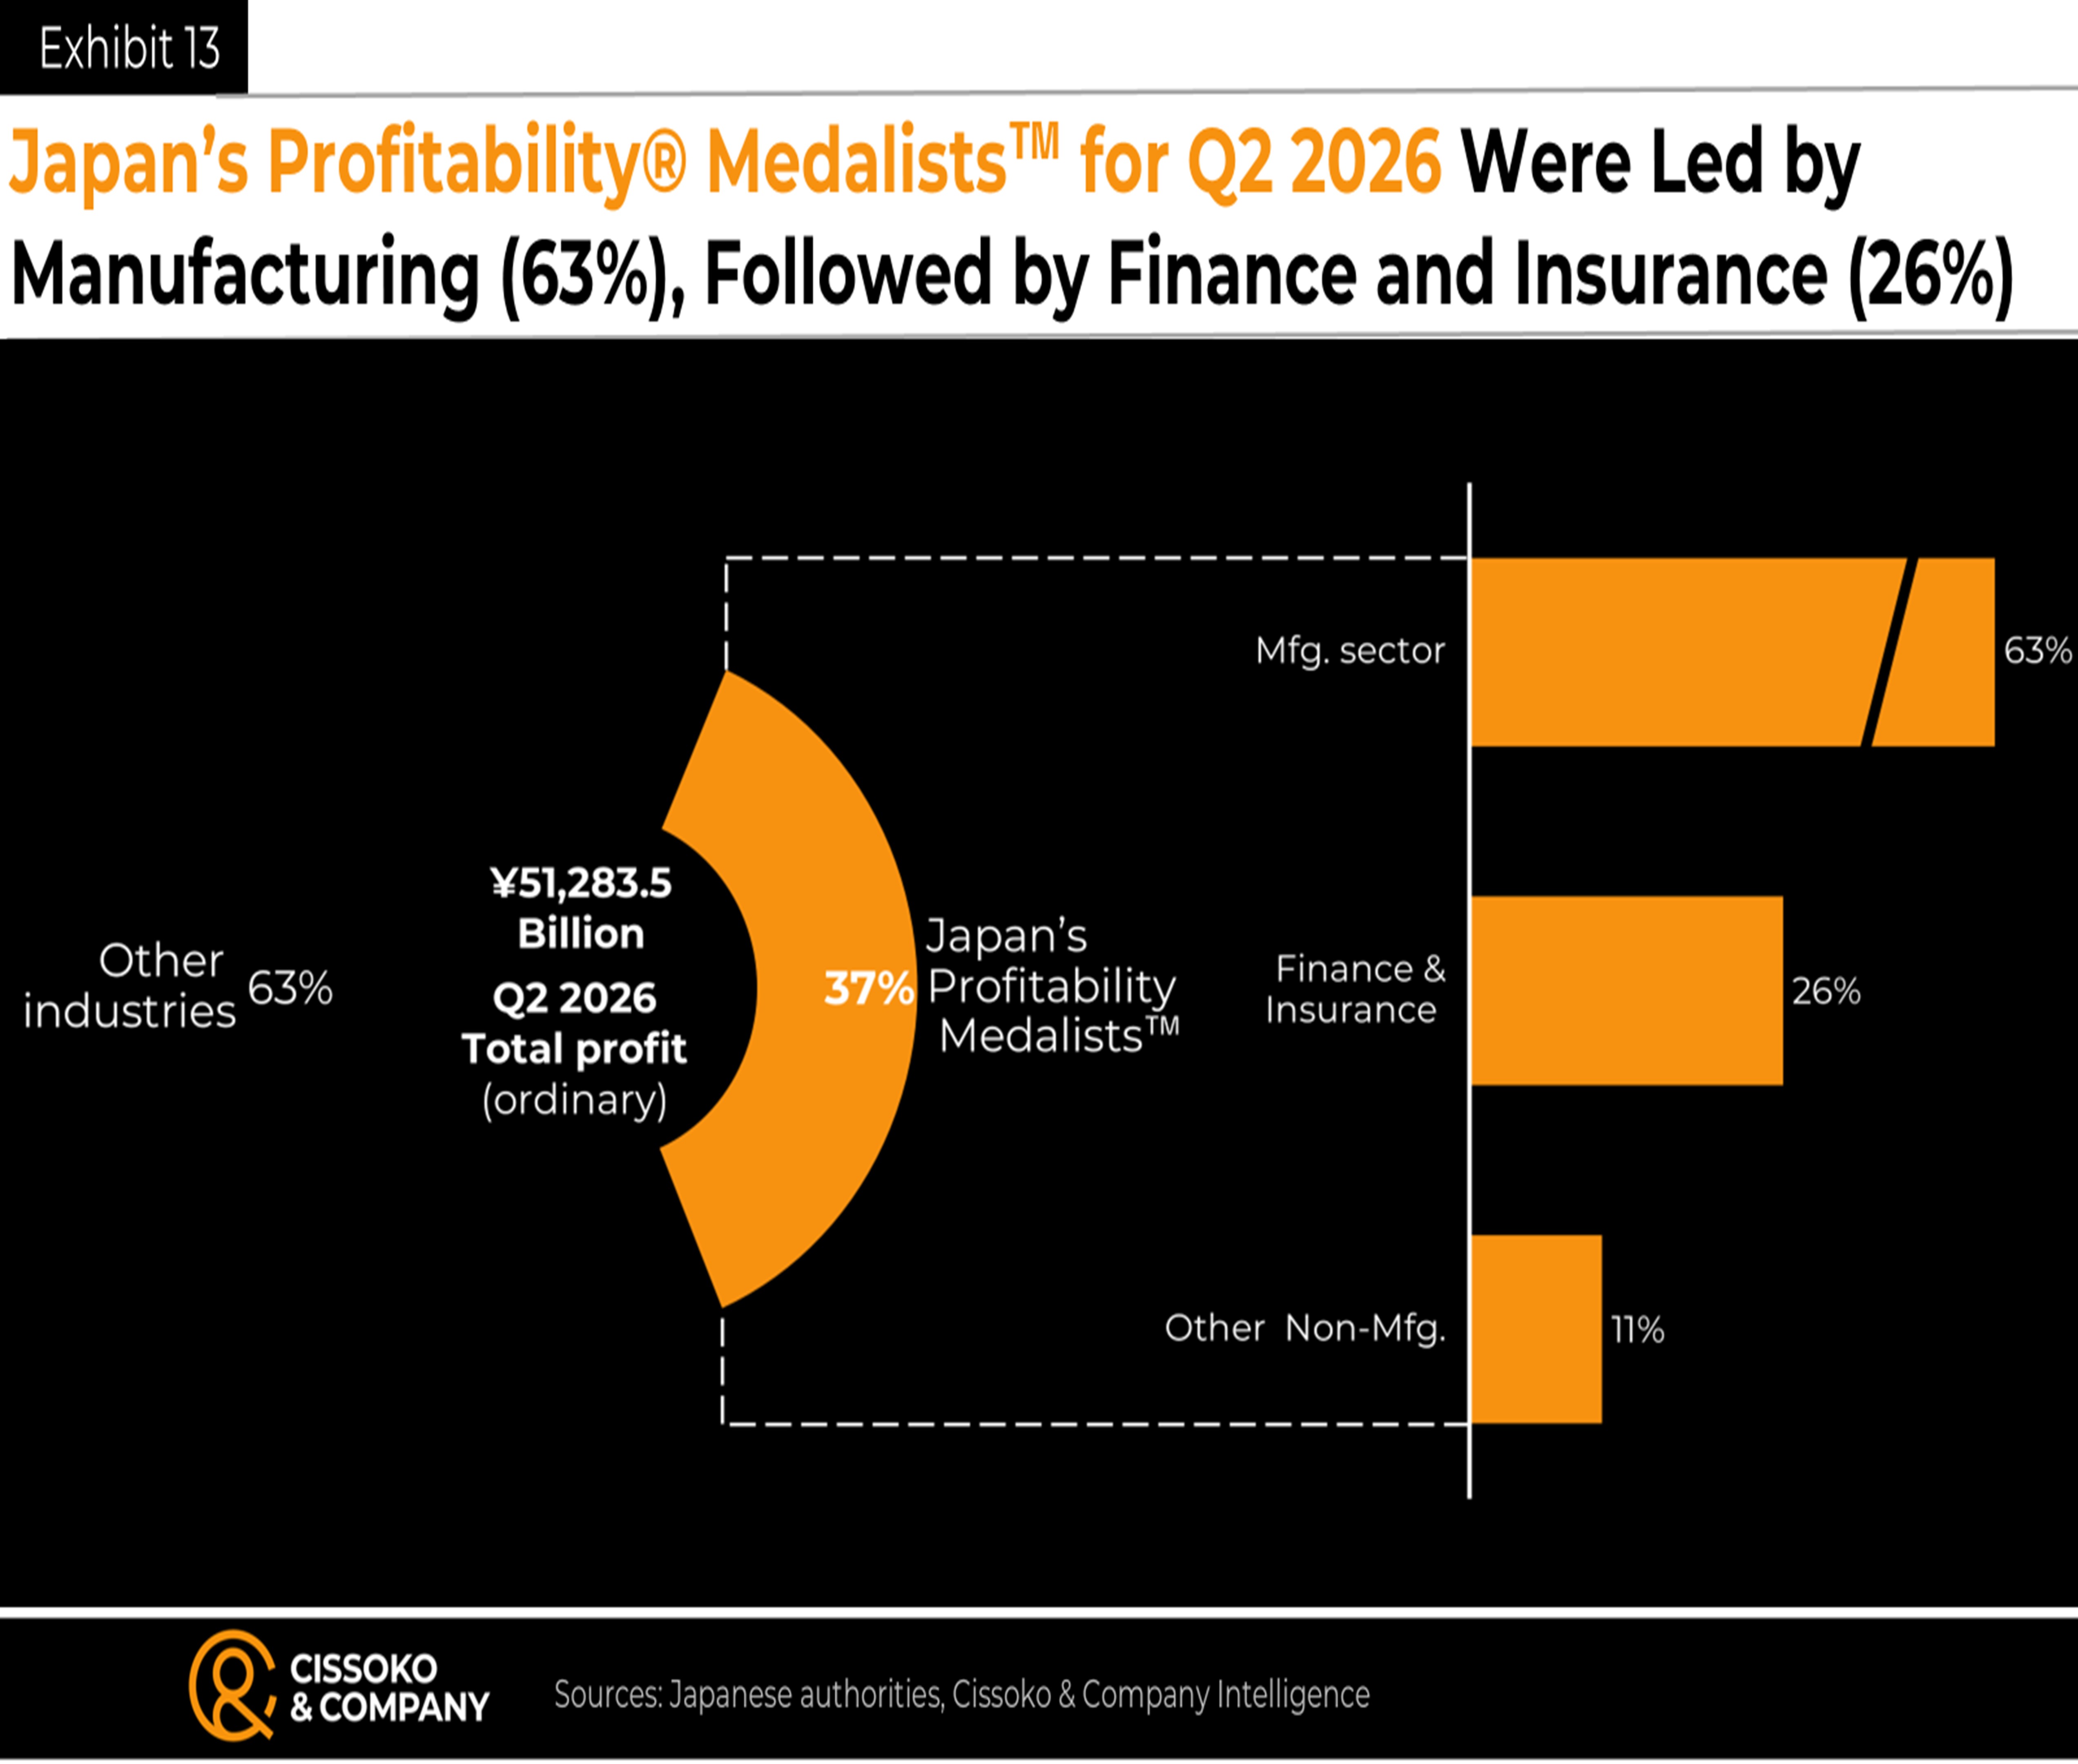
Notably, despite generating most of the national profit, Japan’s non-manufacturing sector produced only one Profitability Medalist™ for Q2 2026: the construction industry, which narrowly met the minimum award threshold.
A Comparative Analysis of the TOP 3 Profitability® Medalists™ for Q1 and Q2 2026
A comparison of the top three winning industries shows that Q1 leaders (petroleum and coal products, banking, and miscellaneous insurance institutions) delivered higher median profit growth than Q2 2026 leaders (information and communications (IT) electronic equipment, financial products, transaction dealers, and fabricated metal products): 465% vs. 143%.
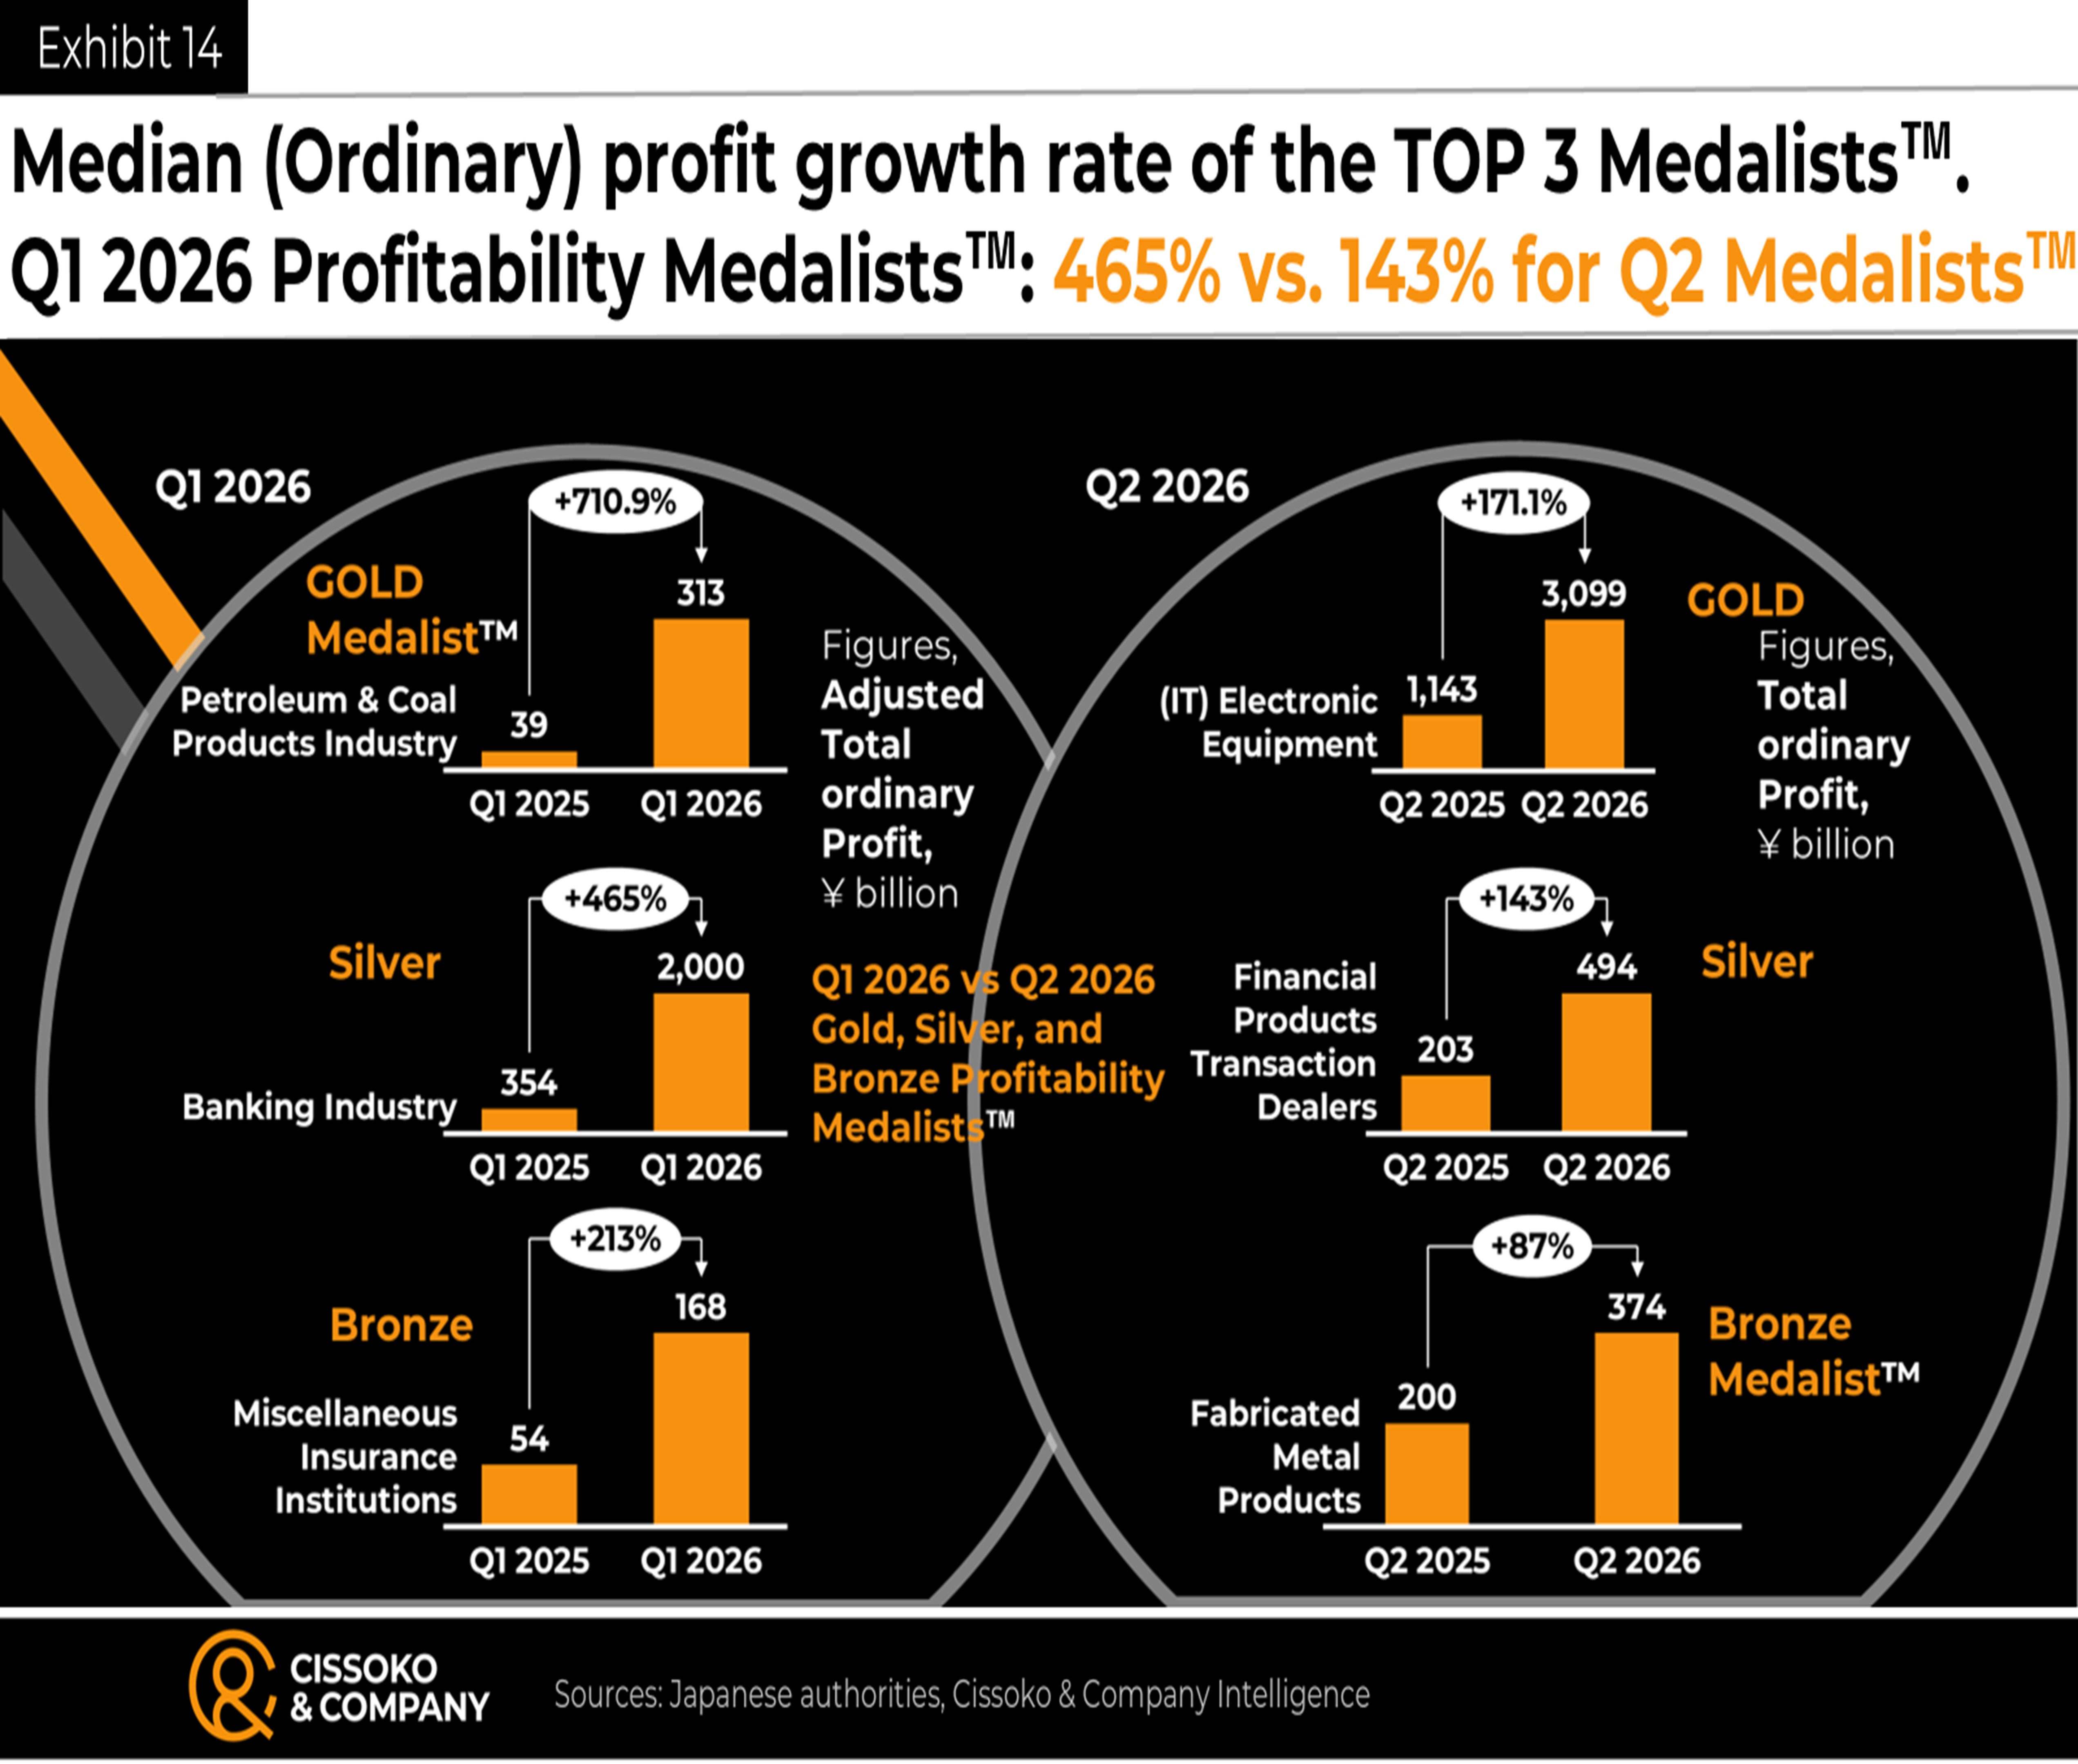
In other words, the top three Q1 2026 winners outperformed the Q2 2026 average by 322 percentage points.
Comparative Analysis of Japan’s Profitability® Medalists™ and the Average Japanese Industry
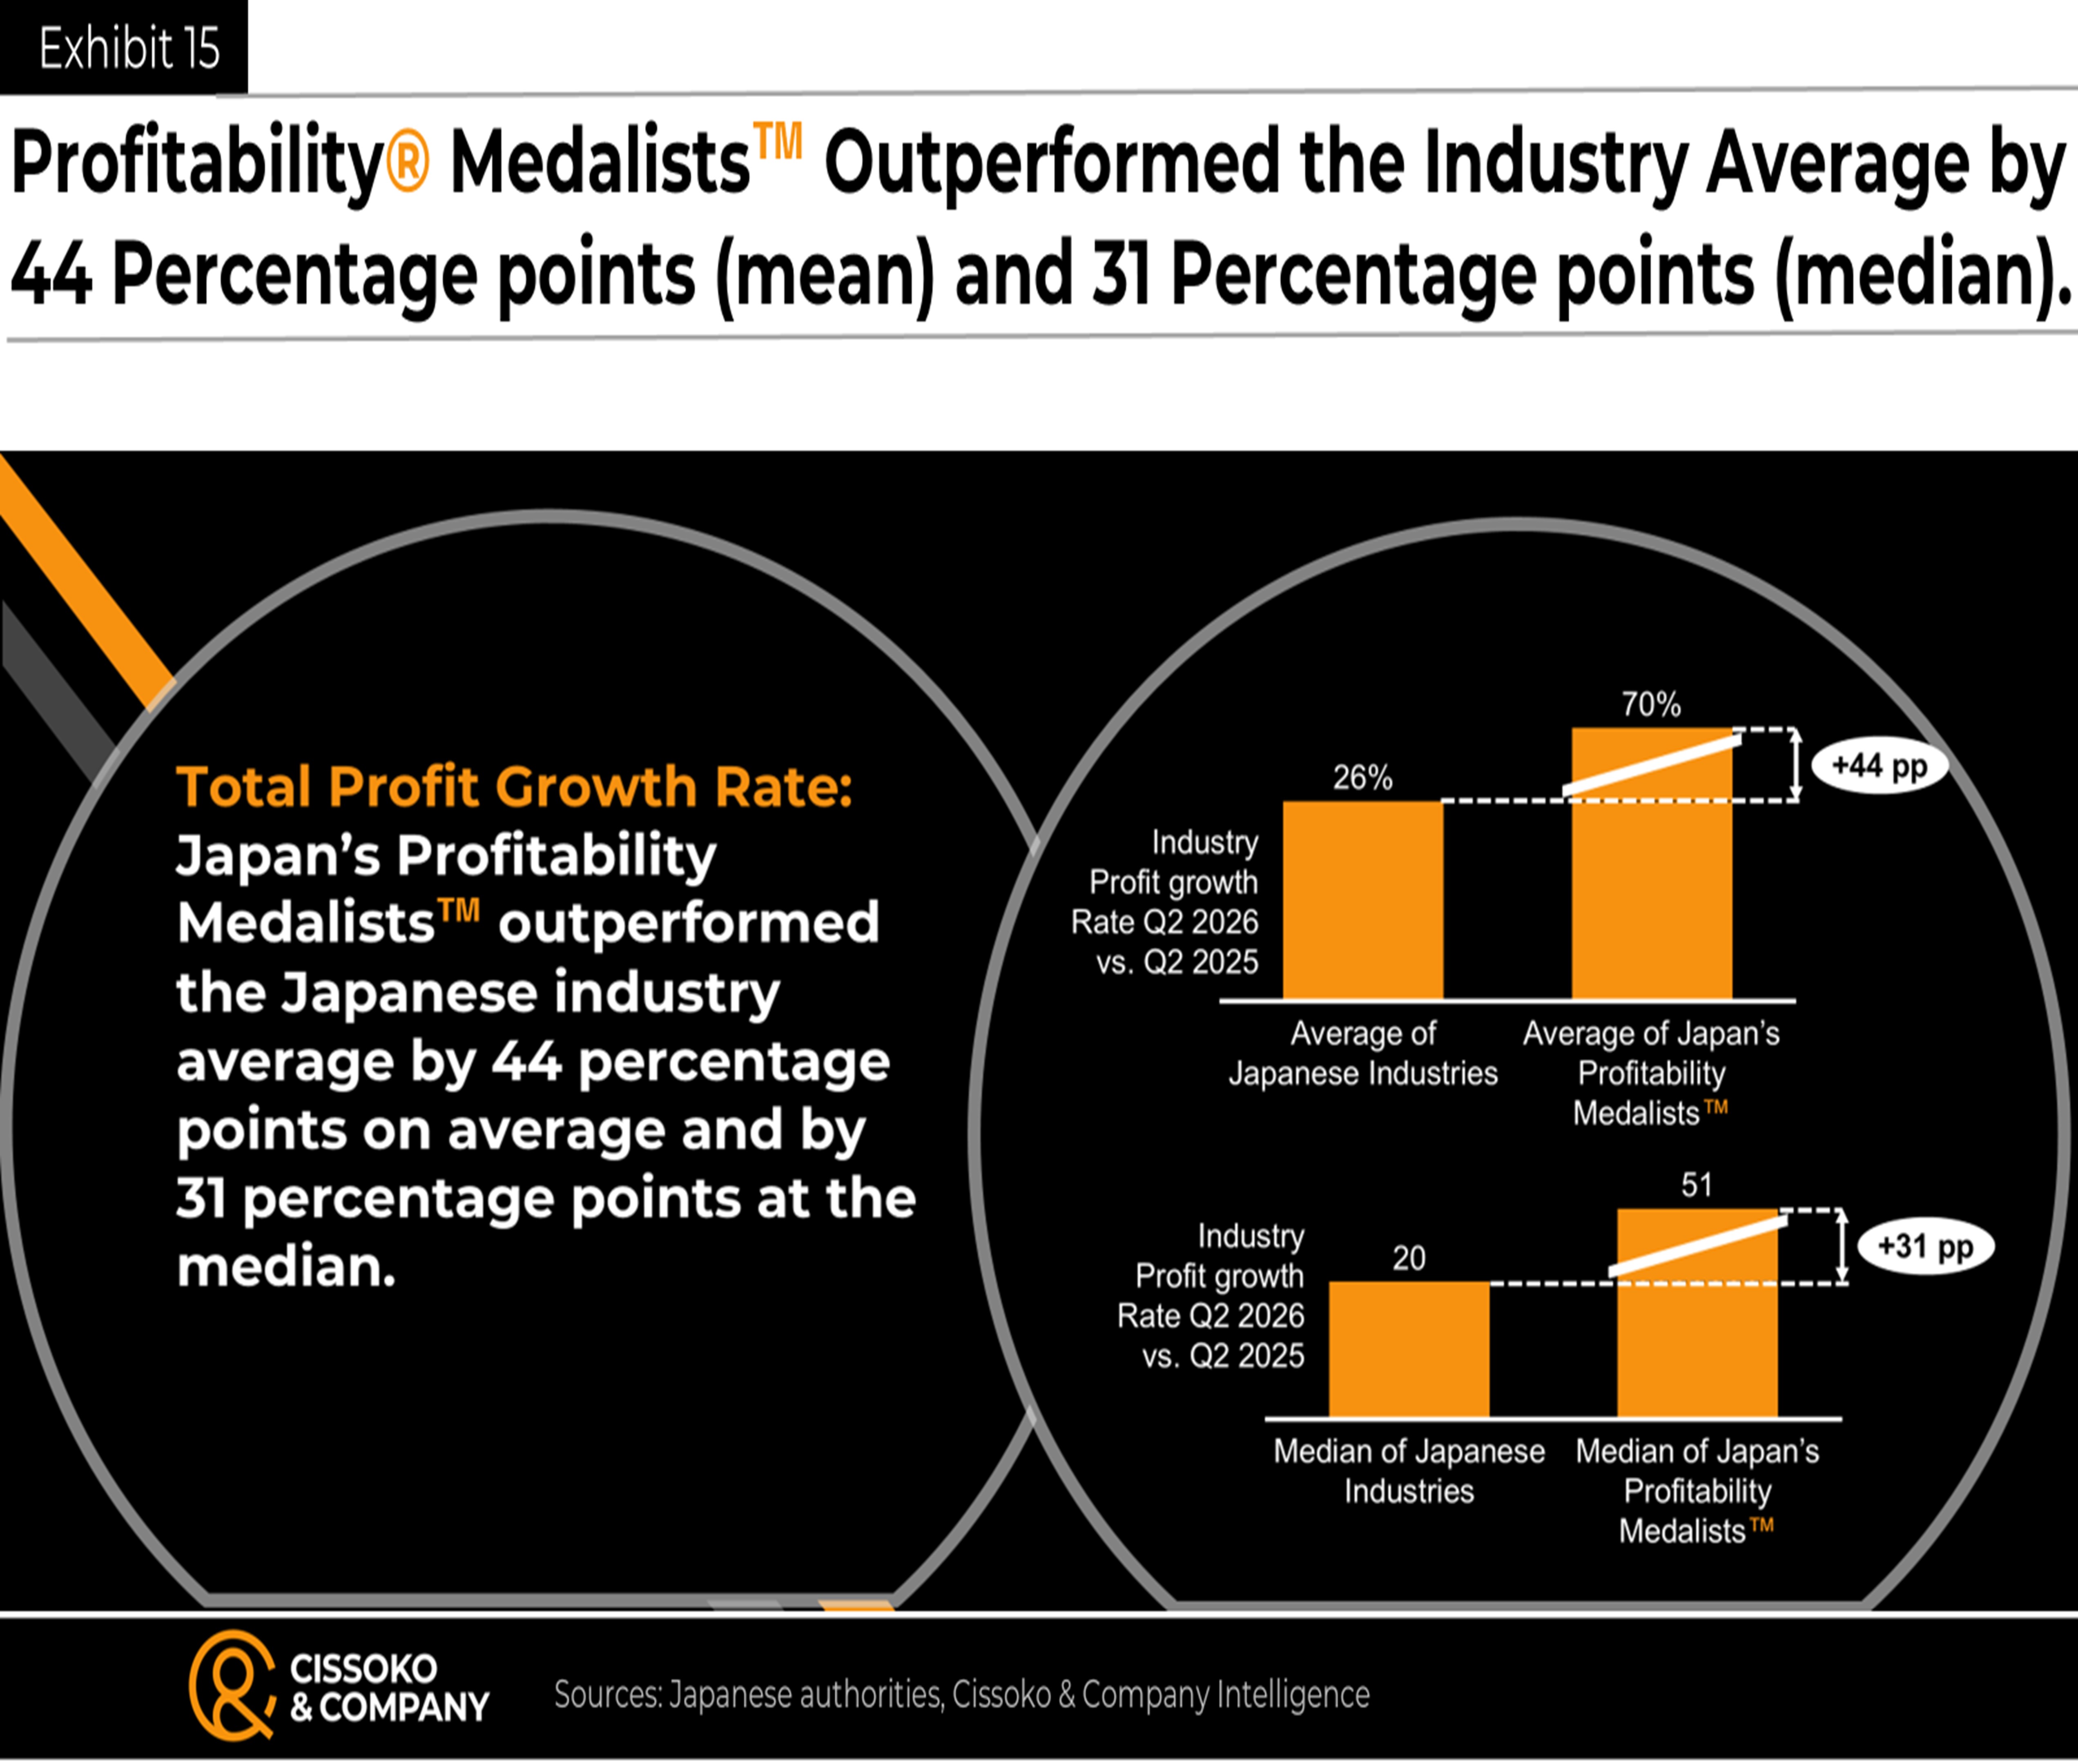
Benchmarking our award winners’ growth rates against all other industries, excluding each winner’s sector (e.g., manufacturing as a whole, combined finance and insurance sector), shows that Japan’s Profitability® Medalists™ outperformed the average Japanese industry by 44 percentage points. At the median, they outperformed the typical Japanese industry by 31 percentage points
Most industry analyses concentrate on large or publicly listed companies, overlooking the contribution of the many SMEs within a sector or across the national economy.
Our research and insights close this gap by revealing the profitability of every industry in Japan, including all types of firms, regardless of their size, giving CEOs and business leaders in Japan and beyond rare, deep visibility into the economic and competitive landscape in the age of AI.
Above all, the insights distinguish Japan’s GDP growth from national profit growth, since conflating the two can be a strategic misstep.
Get in Touch
We will respond to your message as soon as possible.
Insights to Win
Subscribe to our newsletter for in-depth analysis, reports, and our perspectives on business and economic issues related to the Japanese market and the global economy.